Survivorship curves record changes in survival probability over an organism’s life-span.
The age structure of a population reflects death rates as well as birth rates. Demography is the study of the size, structure, and distribution of populations over time and includes changes in response to birth rates, aging, migration, and death. The demography of the invasive Lime Swallowtail butterfly has been studied in Southeast Asia, where it is native, and this investigation may be helpful in predicting the population dynamics of this species in coming years as it spreads from Hispaniola across the Americas.
The factors that cause insect mortality commonly differ from one life stage to the next, and knowing their effects can help us understand the physical and biological influences on population growth. Fig. 46.10 shows the different dangers to each stage of the Lime Swallowtail’s life. These butterflies each lay 30 or more eggs, but only a fraction of the eggs survive because of parasitism, drying out, falling from leaves, or predation by ants or other insects. The larvae have many defenses against predators, among them camouflage and chemical toxins, but they still fall prey to wasps, as well as to lizards and other animals, so the faster they develop into adults, the more likely they are to escape discovery by their enemies. The pupae, which are large and immobile, are perhaps the most vulnerable stage in the Lime Swallowtail life cycle, and they are often highly parasitized by a particular kind of wasp.
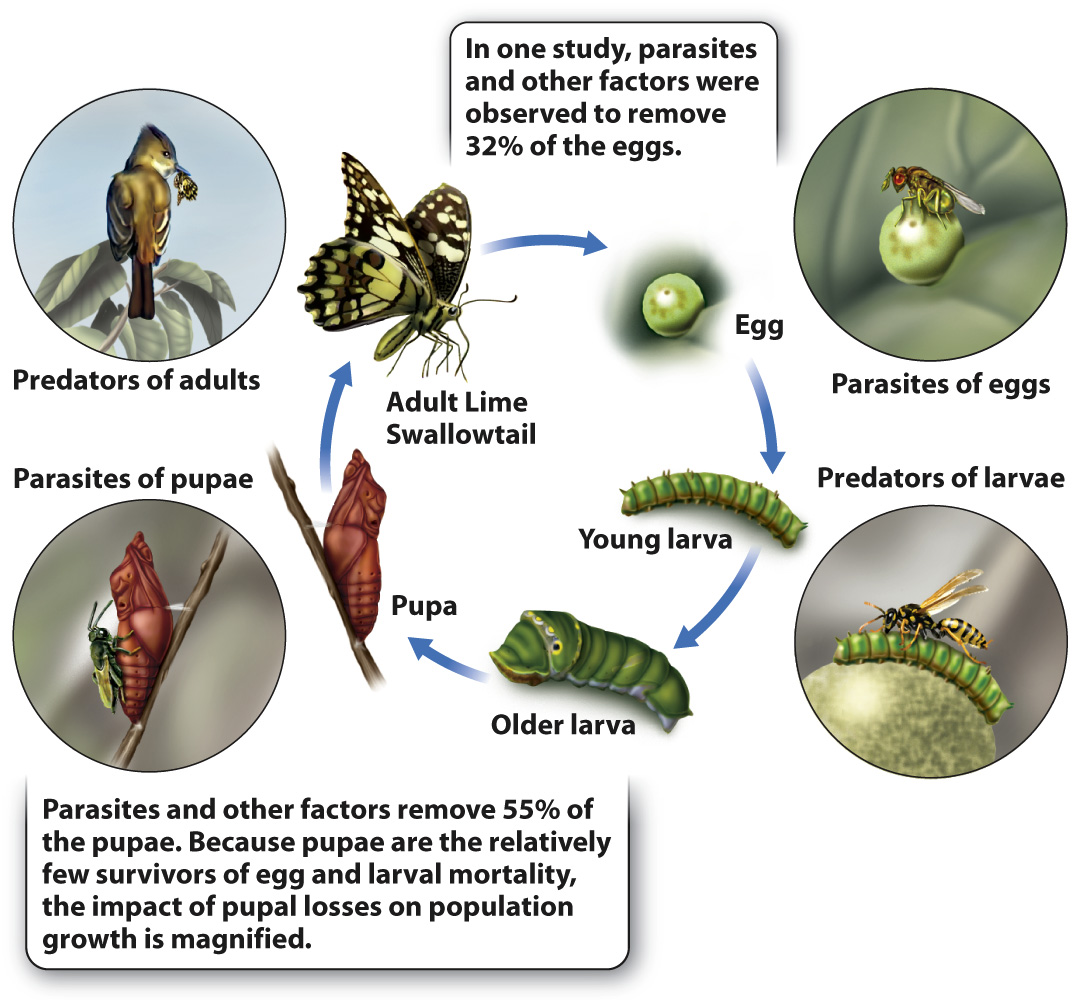
Fig. 46.11 presents data on the duration of each stage in the Lime Swallowtail life cycle and the numbers killed in that stage. We can consider the individual eggs that begin our study to form a cohort, a group defined as the individuals born at a given time, and we can trace their survival as they age. The information about how many individuals of a cohort are alive at different points in time can be summarized in a life table, from which an ecologist can identify patterns of survival in a population. The proportion of individuals from the initial cohort that survive to each successive stage of the life cycle is called survivorship. When survivorship curves are plotted through time, they show an ever-
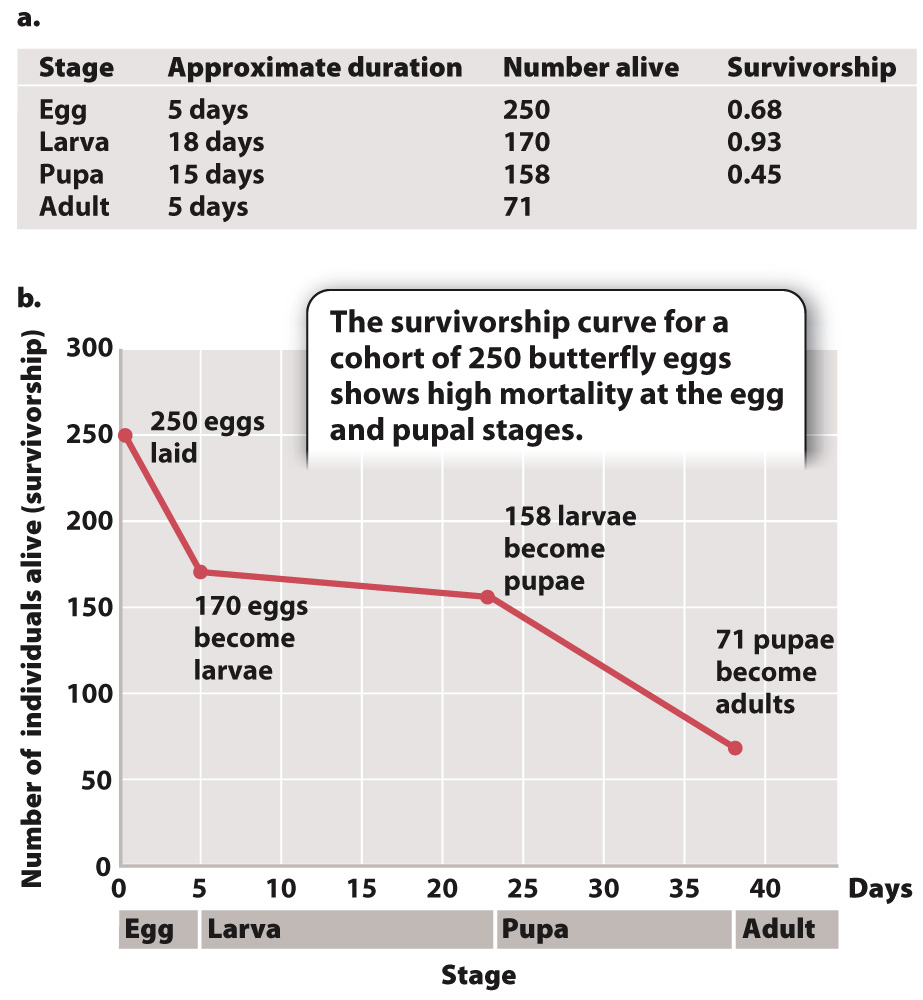
We can see in the life table and the survivorship curve for this example that survival is lowest among eggs (68% survive to the next stage) and pupae (only 45% survive to the next stage), which of course cannot move to escape harm. If we divide the number lost at each stage by the number of days at that stage, we see that the egg stage loses 16 per day, the pupal stage loses 6 per day, but the larval stage loses only 0.6 per day. There is therefore strong selective pressure to decrease the length of each stage, especially those stages most vulnerable to mortality. Nevertheless, if we remember that each adult female can lay 30 or more eggs, only a very few eggs need to survive to the adult egg-