Patterns of survivorship vary among organisms.
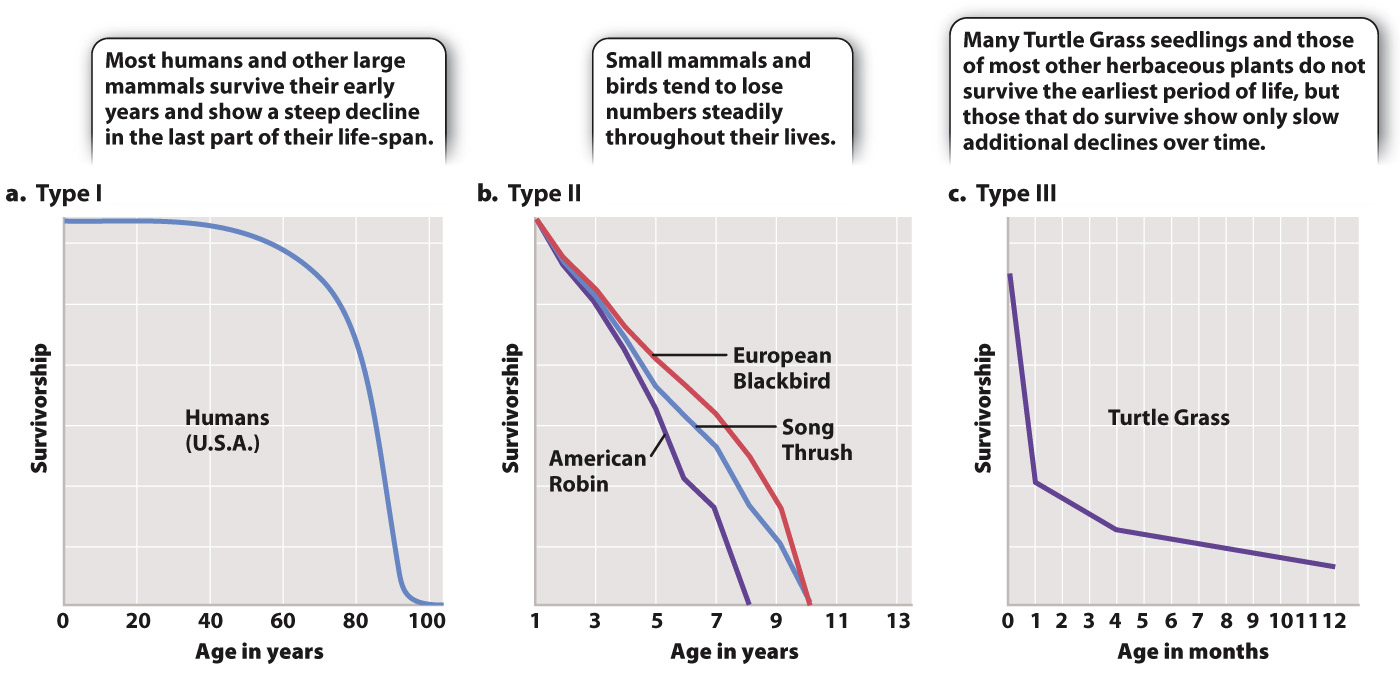
Populations differ in the ages at which they experience the most mortality. In some species, many offspring are produced, but high mortality early in life means that few survive to reproductive age. In other species, mortality is highest in older individuals, while in still other species, mortality occurs with equal frequency at all ages. Fig. 46.12 illustrates the three principal types of survivorship curve—

Human populations in affluent countries experience most mortality late in life, and so typically show a Type I survivorship curve (Fig. 46.12a). Other large animals, such as elephants and whales, show similar survivorship curves. In contrast, birds and many small mammals commonly experience consistent levels of mortality throughout life, which can be graphed as a declining straight line. These animals, for which the probability of death does not change much through the life cycle, exhibit a Type II survivorship curve (Fig. 46.12b). Finally, organisms like Turtle Grass show high mortality at the earliest stages of their life cycles, resulting in a sharply declining survivorship curve that levels off (Fig. 46.12c). This pattern is characteristic of a Type III survivorship curve, which is typical of small herbaceous plants, small animals such as mice, insects like the Lime Swallowtail, and other organisms that grow fast and reproduce early.