30.2 Principles of Test Construction
30-3 What is a normal curve, and what does it mean to say that a test has been standardized and is reliable and valid?
To be widely accepted, a psychological test must meet three criteria: It must be standardized, reliable, and valid. The Stanford-Binet and Wechsler tests meet these requirements.
Standardization
The number of questions you answer correctly on an intelligence test would reveal almost nothing. To know how well you performed, you would need some basis for comparison. That’s why test-makers give new tests to a representative sample of people. The scores from this pretested group become the basis for future comparisons. If you later take the test following the same procedures, your score will be meaningful when compared with others. This process is called standardization.
If we construct a graph of test-takers’ scores, the scores typically form a bell-shaped pattern called the normal curve. No matter what attributes we measure—height, weight, or mental aptitude—people’s scores tend to form a bell curve. The highest point is the midpoint, or the average score. On an intelligence test, we give this average score a value of 100 (FIGURE 30.2). Moving out from the average, toward either extreme, we find fewer and fewer people. For both the Stanford-Binet and Wechsler tests, a person’s score indicates whether that person’s performance fell above or below the average. A performance higher than all but 2 percent of all scores earns an intelligence score of 130. A performance lower than 98 percent of all scores earns an intelligence score of 70.
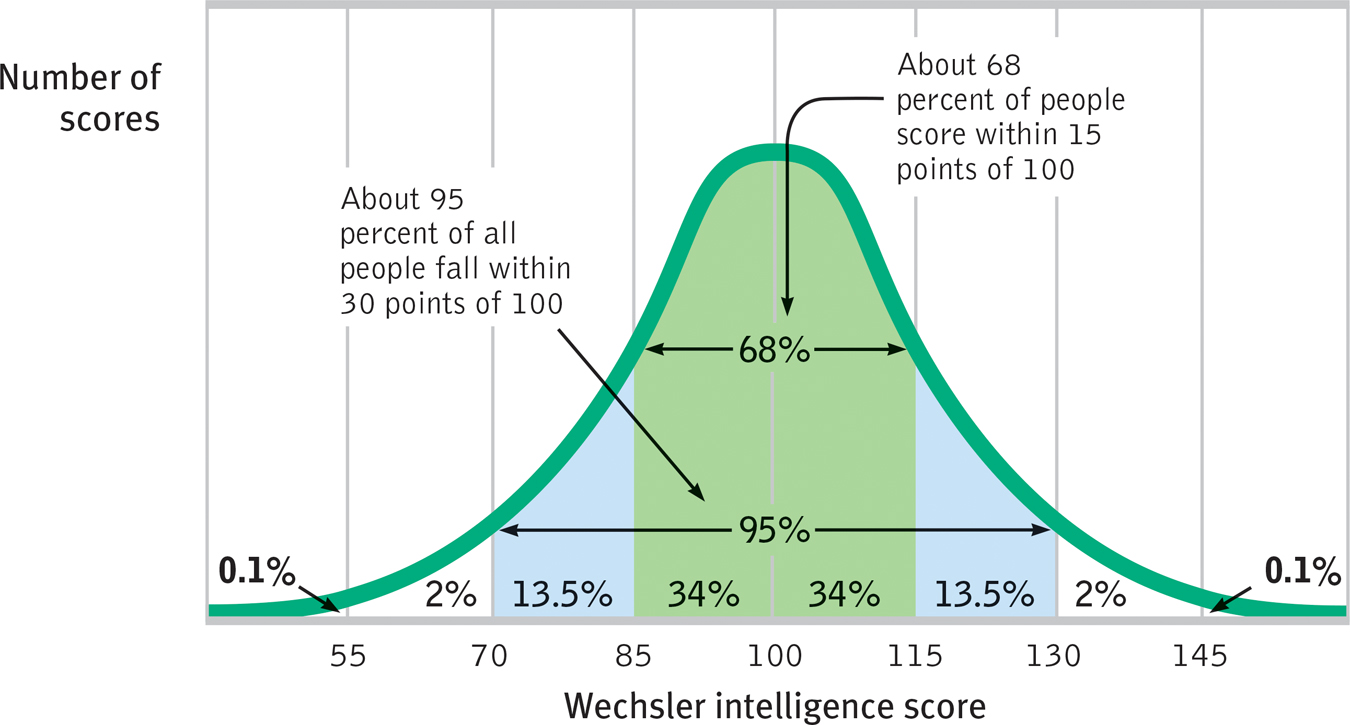
 Figure 30.2
The normal curve Scores on aptitude tests tend to form a normal, or bell-shaped, curve around an average score. For the Wechsler scale, for example, the average score is 100.
To keep the average score near 100, the Stanford-Binet and Wechsler scales are periodically restandardized. If you took the WAIS, Fourth Edition, recently, your performance was compared with a standardization sample who took the test during 2007, not to David Wechsler’s initial 1930s sample. If you compared the performance of the most recent standardization sample with that of the 1930s sample, do you suppose you would find rising or declining test performance? Amazingly—given that college entrance aptitude scores have sometimes dropped, such as during the 1960s and 1970s—intelligence test performance has improved. This worldwide phenomenon is called the Flynn effect, in honor of New Zealand researcher James Flynn (1987, 2012), who first calculated its magnitude. As FIGURE 30.3 indicates, the average person’s intelligence test score in 1920 was—by today’s standard—only a 76! Such rising performance has been observed in 29 countries, from Canada to rural Australia (Ceci & Kanaya, 2010). Although there have been some regional reversals, the historic increase is now widely accepted as an important phenomenon (Lynn, 2009; Teasdale & Owen, 2005, 2008).
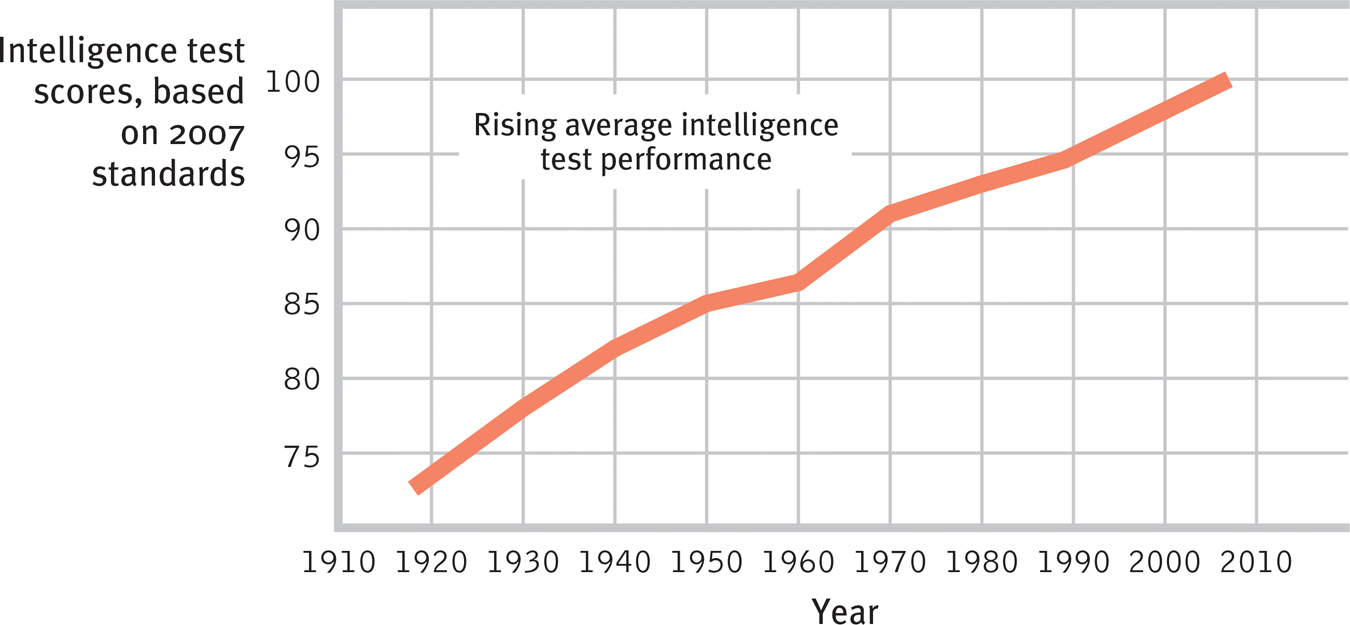
Figure 30.3
Getting smarter? In every country studied, intelligence test performance rose during the twentieth century, as shown here with American Wechsler and Stanford-Binet test performance between 1918 and 2007. In Britain, test scores have risen 27 points since 1942. (Data from Horgan, 1995, updated with Flynn, 2012, 2014.)
The Flynn effect’s cause has been a psychological mystery. Did it result from greater test sophistication? But the gains began before testing was widespread and have even been observed among preschoolers. Better nutrition? As the nutrition explanation would predict, people have gotten not only smarter but taller. But in postwar Britain, notes Flynn (2009), the lower-class children gained the most from improved nutrition but the intelligence performance gains were greater among upper-class children. Or did the Flynn effect stem from more education? More stimulating environments? Less childhood disease? Smaller families and more parental investment (Sundet et al., 2008)? Flynn (2012) attributes the performance increase to our need to develop new mental skills to cope with modern environments. But others argue that it may be accounted for by changes in the tests (Kaufman et al., 2013). Regardless of what combination of factors explains the rise in intelligence test scores, the phenomenon counters one concern of some hereditarians—that the higher twentieth-century birthrates among those with lower scores would shove human intelligence scores downward (Lynn & Harvey, 2008).
Reliability
Knowing where you stand in comparison to a standardization group still won’t say much about your intelligence unless the test has reliability. A reliable test gives consistent scores, no matter who takes the test or when they take it. To check a test’s reliability, researchers test people many times. They may retest using the same test or they may split the test in half to see whether odd-question scores and even-question scores agree. If the two scores generally agree, or correlate, the test is reliable. The higher the correlation between the test-retest or the split-half scores, the higher the test’s reliability. The tests we have considered so far—the Stanford-Binet, the WAIS, and the WISC—are very reliable (about +.9). When retested, people’s scores generally match their first score closely.
Validity
High reliability does not ensure a test’s validity—the extent to which the test actually measures or predicts what it promises. Imagine using a miscalibrated tape measure to measure people’s heights. Your results would be very reliable. No matter how many times you measured, people’s heights would be the same. But your results would not be valid—you would not be giving the information you promised—real height.
Tests that tap the pertinent behavior, or criterion, have content validity. The road test for a driver’s license has content validity because it samples the tasks a driver routinely faces. Course exams have content validity if they assess one’s mastery of a representative sample of course material. But we expect intelligence tests to have predictive validity: They should predict the criterion of future performance, and to some extent they do.
Are general aptitude tests as predictive as they are reliable? As critics are fond of noting, the answer is plainly No. The predictive power of aptitude tests is fairly strong in the early school years, but later it weakens. Academic aptitude test scores are reasonably good predictors of achievement for children ages 6 to 12, where the correlation between intelligence score and school performance is about +.6 (Jensen, 1980). Intelligence scores correlate even more closely with scores on achievement tests: +.81 in one comparison of 70,000 English children’s intelligence scores at age 11 with their academic achievement in national exams at age 16 (Deary et al., 2007, 2009). The SAT, used in the United States as a college entrance exam, has been less successful in predicting first-year college grades. (The correlation, less than +.5, has been, however, a bit higher when adjusting for high scorers electing tougher courses [Berry & Sackett, 2009; Willingham et al., 1990].) By the time we get to the Graduate Record Examination (GRE; an aptitude test similar to the SAT but for those applying to graduate school), the correlation with graduate school performance is an even more modest but still significant +.4 (Kuncel & Hezlett, 2007).
Why does the predictive power of aptitude scores diminish as students move up the educational ladder? Consider a parallel situation: Among all American and Canadian football linemen, body weight correlates with success. A 300-pound player tends to overwhelm a 200-pound opponent. But within the narrow 280- to 320-pound range typically found at the professional level, the correlation between weight and success becomes negligible (FIGURE 30.4). The narrower the range of weights, the lower the predictive power of body weight becomes. If an elite university takes only those students who have very high aptitude scores, and then gives them a restricted range of high grades, those scores cannot possibly predict much. This will be true even if the test has excellent predictive validity with a more diverse sample of students. Likewise, modern grade inflation has produced less diverse high school grades. With their diminished range, high school grades now predict college grades no better than have SAT scores (Sackett et al., 2012). So, when we validate a measure using a wide range of scores but then use it with a restricted range of scores, it loses much of its predictive validity.
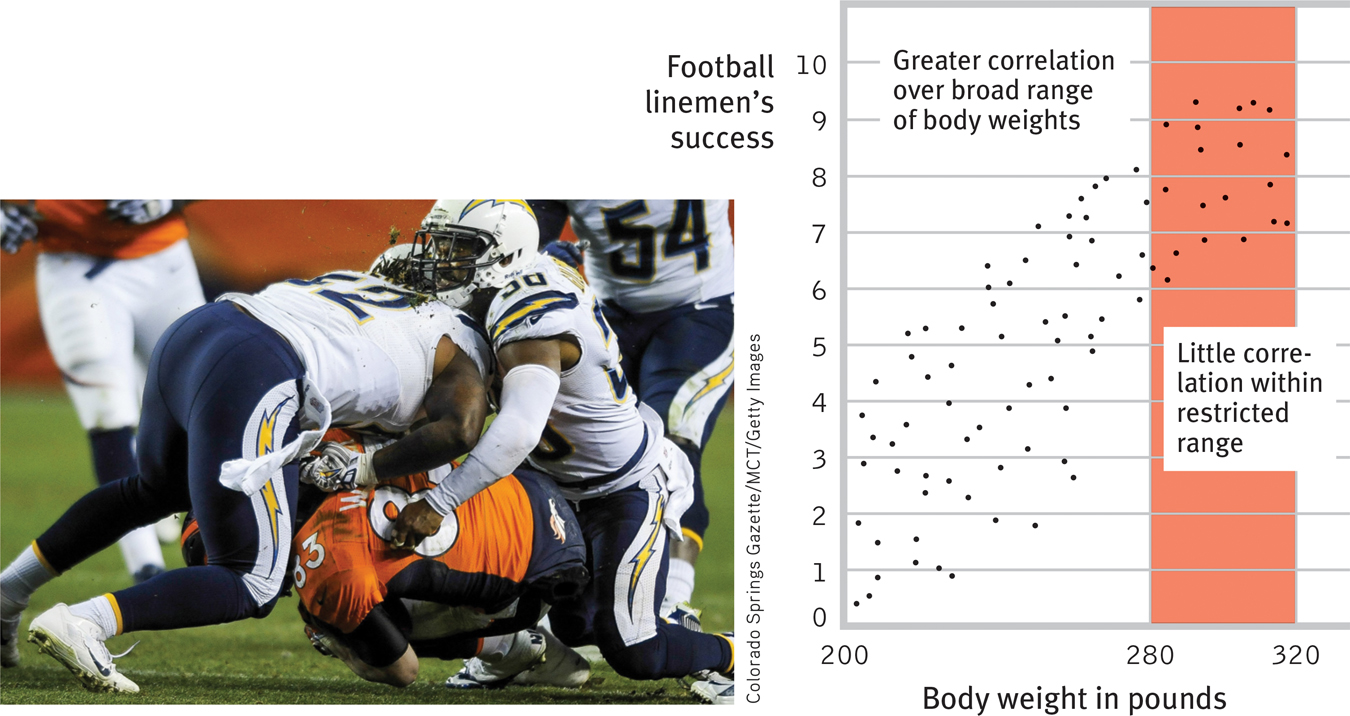
Figure 30.4
Diminishing predictive power Let’s imagine a correlation between football linemen’s body weight and their success on the field. Note how insignificant the relationship becomes when we narrow the range of weight to 280 to 320 pounds. As the range of data under consideration narrows, its predictive power diminishes.
RETRIEVAL PRACTICE
- What are the three criteria that a psychological test must meet in order to be widely accepted? Explain.
A psychological test must be standardized (pretested on a similar group of people), reliable (yielding consistent results), and valid (measuring what it is supposed to measure).
- Correlation coefficients were used in this section. Here’s a quick review: Correlations do not indicate cause-effect, but they do tell us whether two things are associated in some way. A correlation of −1.0 represents perfect ______________ (agreement/disagreement) between two sets of scores: As one score goes up, the other score goes ______________ (up/down). A correlation of ______________ represents no association. The highest correlation, +1.0, represents perfect ______________ (agreement/disagreement): As the first score goes up, the other score goes ______________ (up/down).
disagreement; down; zero; agreement; up