32.3 Group Differences in Intelligence Test Scores

If there were no group differences in aptitude test scores, psychologists could politely debate hereditary and environmental influences in their ivory towers. But there are group differences. What are they? And what shall we make of them?

Gender Similarities and Differences

32-3 How and why do the genders differ in mental ability scores?

In science, as in everyday life, differences, not similarities, excite interest. Compared with the anatomical and physiological similarities between men and women, our intelligence differences are minor. In a 1932 testing of all Scottish 11-year-olds, for example, girls’ average intelligence score was 100.6 and boys’ was 100.5 (Deary et al., 2003). So far as g is concerned, boys and girls, men and women, are the same species.

Yet, most people find differences more newsworthy. Girls outpace boys in spelling, verbal fluency, locating objects, detecting emotions, and sensitivity to touch, taste, and color (Halpern et al., 2007). Boys outperform girls in tests of spatial ability and complex math problems, though in math computation and overall math performance, boys and girls hardly differ (Else-Quest et al., 2010; Hyde & Mertz, 2009; Lindberg et al., 2010). Males’ mental ability scores also vary more than females’. Thus, boys worldwide outnumber girls at both the low extreme and the high extreme (Brunner et al., 2013). Boys, for example, are more often found in special education classes, but also among those scoring very high on the SAT math test.

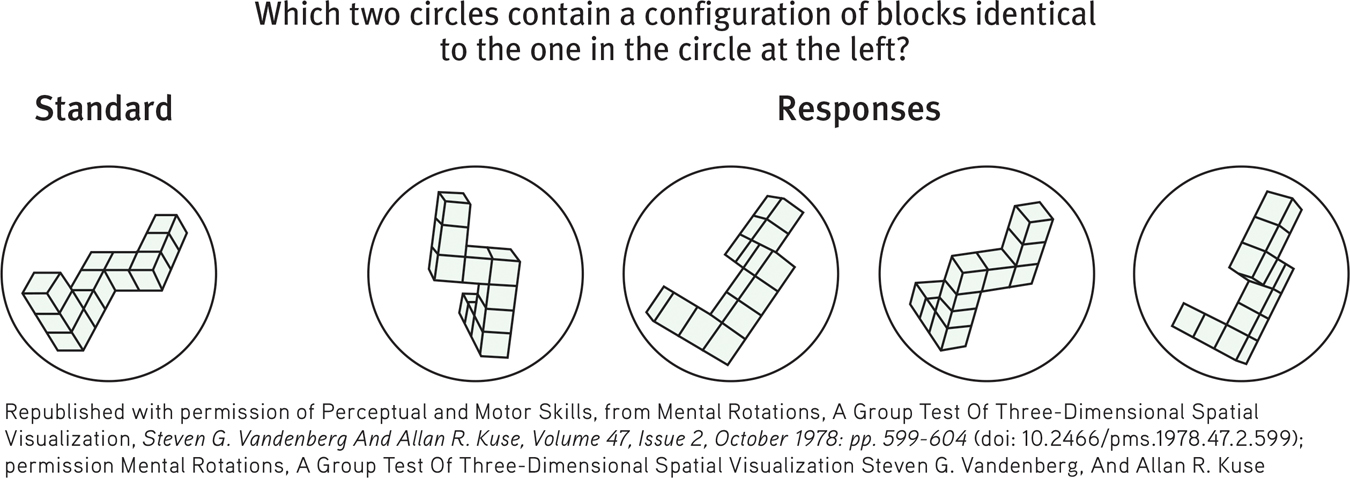
The most reliable male edge appears in spatial ability tests like the one shown in FIGURE 32.3 (Maeda & Yoon, 2013; Wei et al., 2012). The solution requires speedily rotating three-dimensional objects in one’s mind. Today, such skills help when fitting suitcases into a car trunk, playing chess, or doing certain types of geometry problems. From an evolutionary perspective, those same skills would have helped our ancestral fathers track prey and make their way home (Geary, 1995, 1996; Halpern et al., 2007). The survival of our ancestral mothers may have benefited more from a keen memory for the location of edible plants—a legacy that lives today in women’s superior memory for objects and their location.

Figure 32.3
The mental rotation test
This is a test of spatial abilities. (From Vandenberg & Kuse, 1978.) See answer below.
ANSWER: The first and fourth alternatives.
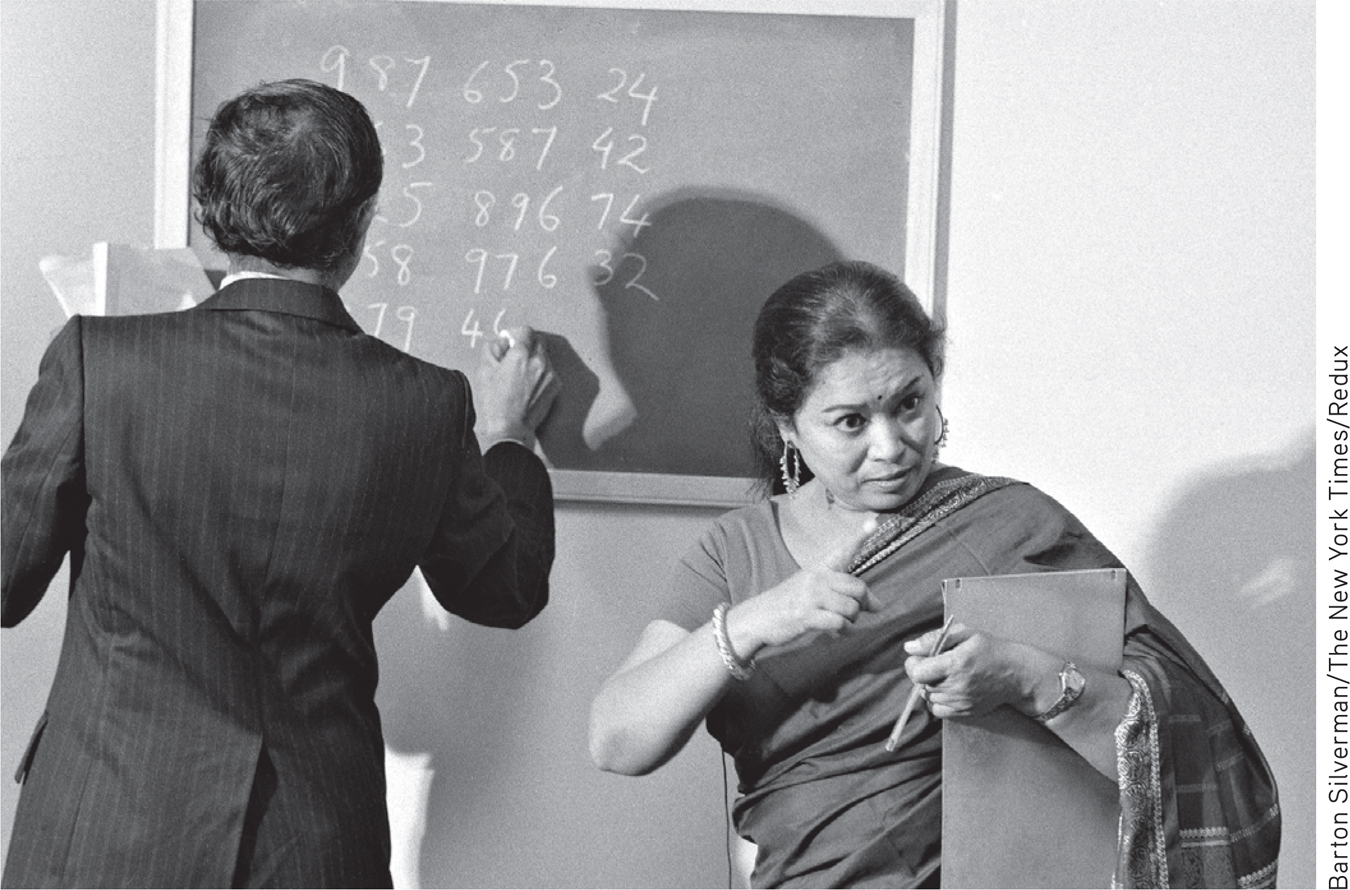
“The human computer” Indian math wizard Shakuntala Devi made it into the 1982 Guinness Book of World Records when she multiplied two randomly selected 13-digit numbers (7,686,369,774,870 × 2,465,099,745,779) to give, within seconds, the 26-digit solution: 18,947,668,177,995,426,462,773,730 (Pandya, 2013).

But experience matters. One experiment found that playing action video games boosts spatial abilities, generally a male more than female pursuit (Eagan et al, 2013; Feng et al., 2007). Evolutionary psychologist Steven Pinker (2005) has argued that biology affects gender differences in life priorities (women’s greater interest in people versus men’s in money and things), in risk-taking (with men more reckless), and in math reasoning and spatial abilities. Such differences are, he noted, observed across cultures, stable over time, influenced by prenatal hormones, and observed in genetic boys raised as girls. But social influences also construct gender. Stephen Ceci and Wendy Williams (2010, 2011) note that culturally influenced preferences help explain women selecting people-rather than math-intensive vocations.

411

Other researchers remind us that social expectations and divergent opportunities shape boys’ and girls’ interests and abilities (Crawford et al., 1995; Eccles et al., 1990). In Asia and Russia, teen girls have outperformed boys in an international science exam; in North America and Britain, boys have scored higher (Fairfield, 2012). More gender-equal cultures, such as Sweden and Iceland, exhibit little of the gender math gap found in gender-unequal cultures, such as Turkey and Korea (Guiso et al., 2008; Kane & Mertz, 2012). Since the 1970s, as gender equity has increased in the United States, the boy-to-girl ratio among 12- to 14-year-olds with very high SAT math scores (above 700) has declined from 13 to 1 to 3 to 1 (Nisbett et al., 2012).

Racial and Ethnic Similarities and Differences

32-4 How and why do racial and ethnic groups differ in mental ability scores?

Fueling the group-differences debate are two other disturbing but agreed-upon facts:

There are many group differences in average intelligence test scores. New Zealanders of European descent outscore native Maori New Zealanders. Israeli Jews outscore Israeli Arabs. Most Japanese outscore most Burakumin, a stigmatized Japanese minority. Those who can hear have outscored those born deaf (Braden, 1994; Steele, 1990; Zeidner, 1990). And White Americans have outscored Black Americans. This Black-White difference has diminished somewhat in recent years, especially among children (Dickens & Flynn, 2006; Nisbett et al., 2012). Such group differences provide little basis for judging individuals. Worldwide, women outlive men by four years, but knowing only that you are male or female won’t tell us how long you will live.

We have seen that heredity contributes to individual differences in intelligence. But group differences in a heritable trait may be entirely environmental. Consider one of nature’s experiments: Allow some children to grow up hearing their culture’s dominant language, while others, born deaf, do not. Then give both groups an intelligence test rooted in the dominant language, and (no surprise) those with expertise in that language will score higher. Although individual performance differences may be substantially genetic, the group difference is not (FIGURE 32.4).

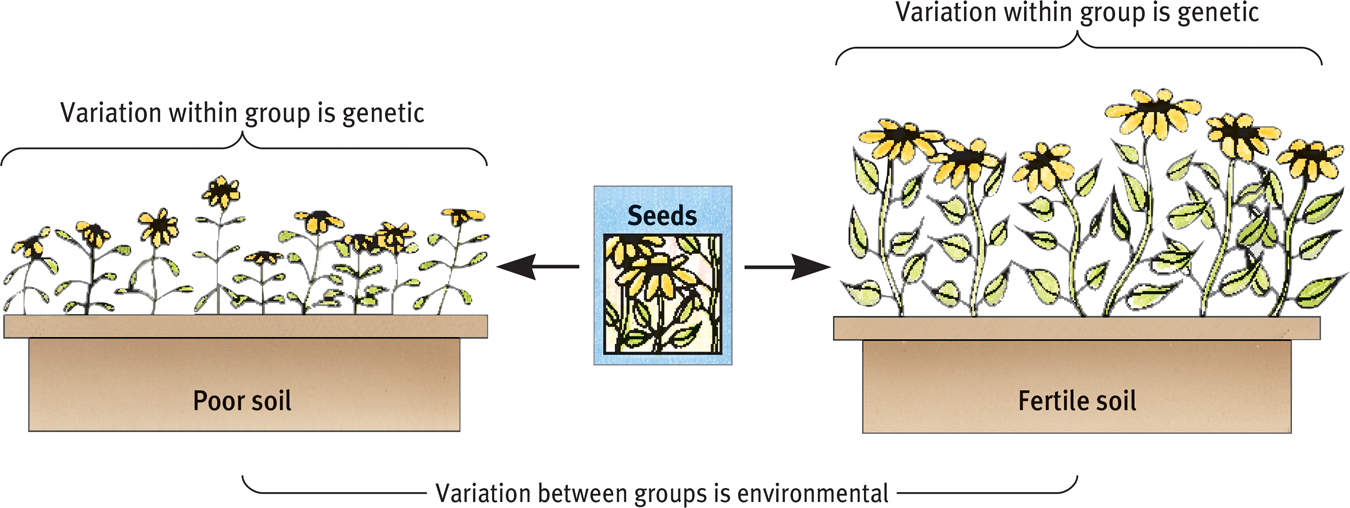
Figure 32.4
Group differences and environmental impact Even if the variation between members within a group reflects genetic differences, the average difference between groups may be wholly due to the environment. Imagine that seeds from the same mixture are sown in different soils. Although height differences within each window box of flowers will be genetic, the height difference between the two groups will be environmental. (Inspired by Lewontin, 1976.)

412

Might the racial gap be similarly environmental? Consider:

Genetics research reveals that under the skin, the races are remarkably alike. The average genetic difference between two Icelandic villagers or between two Kenyans greatly exceeds the group difference between Icelanders and Kenyans (Cavalli-Sforza et al., 1994; Rosenberg et al., 2002). Moreover, looks can deceive. Light-skinned Europeans and dark-skinned Africans are genetically closer than are dark-skinned Africans and dark-skinned Aboriginal Australians.

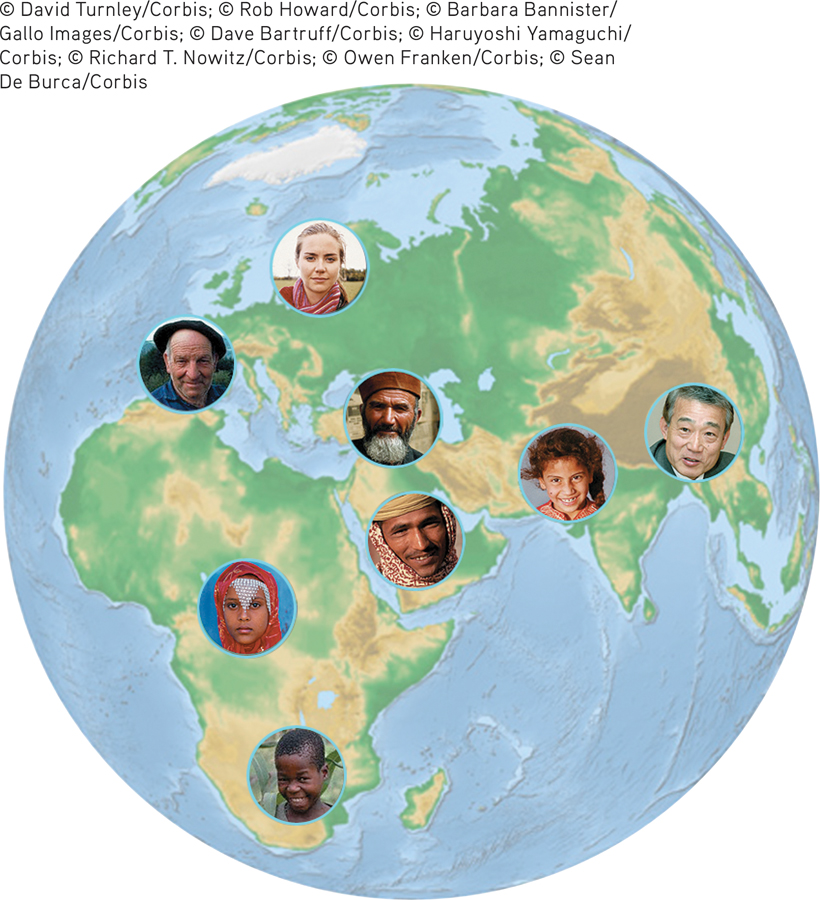
Nature’s own morphing Nature draws no sharp boundaries between races, which blend gradually one into the next around the Earth. But the human urge to classify causes people to socially define themselves in racial categories, which become catchall labels for physical features, social identity, and nationality.

Race is not a neatly defined biological category. Many social scientists see race primarily as a social construction without well-defined physical boundaries, as each race blends seamlessly into the race of its geographical neighbors (Helms et al., 2005; Smedley & Smedley, 2005). Moreover, with increasingly mixed ancestries, more and more people defy neat racial categorization and self-identify as multiracial (Pauker et al., 2009).

The intelligence test performance of today’s better-fed, better-educated, and more test-prepared population exceeds that of the 1930s population—by a greater margin than the intelligence test score of the average White today exceeds that of the average Black. One research review noted that the average intelligence test performance of today’s sub-Saharan Africans is the same as British adults in 1948, with the possibility of more gains to come, given improved nutrition, economic development, and education (Wicherts et al., 2010).

When Blacks and Whites have or receive the same pertinent knowledge, they exhibit similar information-processing skill. “The data support the view that cultural differences in the provision of information may account for racial differences in [intelligence test performance],” reported researchers Joseph Fagan and Cynthia Holland (2007).

Schools and culture matter. Countries whose economies create a large wealth gap between rich and poor tend also to have a large rich-versus-poor intelligence test score gap (Nisbett, 2009). Moreover, educational policies such as kindergarten attendance, school discipline, and instructional time per year predict national differences in intelligence and knowledge tests (Rindermann & Ceci, 2009). Math achievement and aptitude test differences may reflect conscientiousness more than competence. Asian students who have outperformed North American students on such tests have also spent 30 percent more time in school and much more time in and out of school studying math (Geary et al., 1996; Larson & Verma, 1999; Stevenson, 1992).

“Do not obtain your slaves from Britain, because they are so stupid and so utterly incapable of being taught.”

Cicero, 106-43 B.C.E.

In different eras, different ethnic groups have experienced golden ages—periods of remarkable achievement. Twenty-five-hundred years ago, it was the Greeks and the Egyptians, then the Romans. In the eighth and ninth centuries, genius seemed to reside in the Arab world. Five hundred years ago, the Aztec Indians and the peoples of Northern Europe were the superachievers. Today, many people notice Asian technological genius and Jewish cultural success. Cultures rise and fall over centuries; genes do not. That fact makes it difficult to attribute a natural superiority to any race.

413

RETRIEVAL PRACTICE

  • In prosperous country X, everyone eats all they want. In country Y, the rich are well fed, but the semistarved poor are often thin. In which country will the heritability of body weight be greater?

The heritability (differences due to genes) of body weight will be greater in country X, where environmental differences in available nutrition are minimal.