3.3 Correlation
3-
Describing behavior is a first step toward predicting it. Naturalistic observations and surveys often show us that one trait or behavior is related to another. In such cases, we say the two correlate. A statistical measure (the correlation coefficient) helps us figure how closely two things vary together, and thus how well either one predicts the other. Knowing how much aptitude test scores correlate with school success tells us how well the scores predict school success.
Throughout this book, we will often ask how strongly two things are related: For example, how closely related are the personality scores of identical twins? How well do intelligence test scores predict career achievement? How closely is stress related to disease? In such cases, scatterplots can be very revealing.
Each dot in a scatterplot represents the values of two variables. The three scatterplots in FIGURE 3.3 illustrate the range of possible correlations from a perfect positive to a perfect negative. (Perfect correlations rarely occur in the real world.) A correlation is positive if two sets of scores, such as height and weight, tend to rise or fall together.
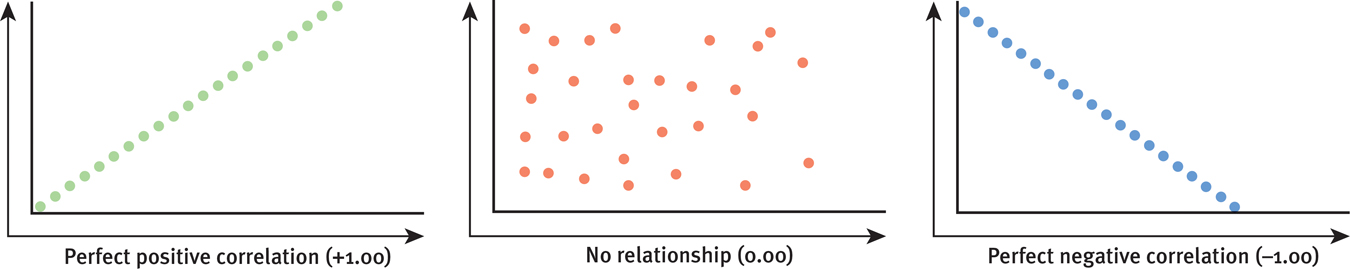
Scatterplots, showing patterns of correlation Correlations can range from +1.00 (scores on one measure increase in direct proportion to scores on another), to 0.00 (no relationship), to −1.00 (scores on one measure decrease precisely as scores rise on the other).
Saying that a correlation is “negative” says nothing about its strength. A correlation is negative if two sets of scores relate inversely, one set going up as the other goes down. The study of University of Nevada students discussed earlier found their reports of inner speech correlated negatively (−.36) with their reported psychological distress. Those who reported more inner speech tended to report somewhat less psychological distress.
Statistics can help us see what the naked eye sometimes misses. To demonstrate this for yourself, try an imaginary project. You wonder if tall men are more or less easygoing, so you collect two sets of scores: men’s heights and men’s temperaments. You measure the heights of 20 men, and you have someone else independently assess their temperaments from 0 (extremely calm) to 100 (highly reactive).
With all the relevant data right in front of you (TABLE 3.2), can you tell whether the correlation between height and reactive temperament is positive, negative, or close to zero?
Height and Temperamental Reactivity of 20 Men
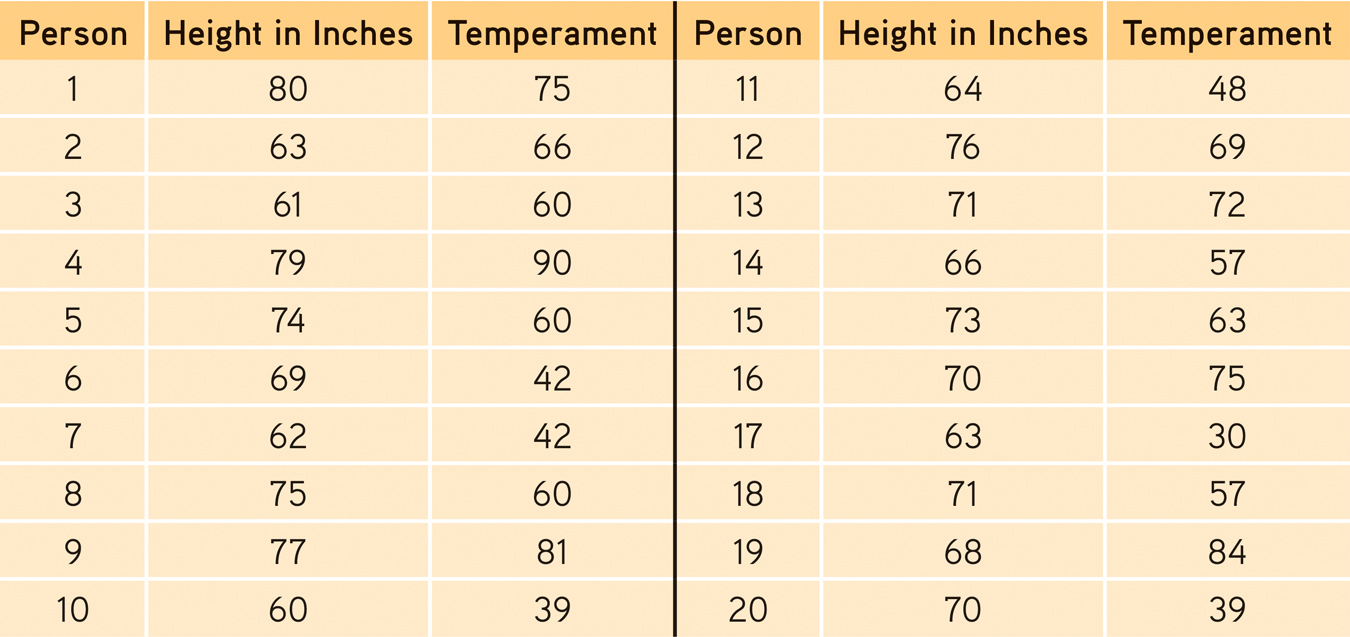
Comparing the columns in Table 3.2, most people detect very little relationship between height and temperament. In fact, the correlation in this imaginary example is positive, +.63, as we can see if we display the data as a scatterplot (FIGURE 3.4).
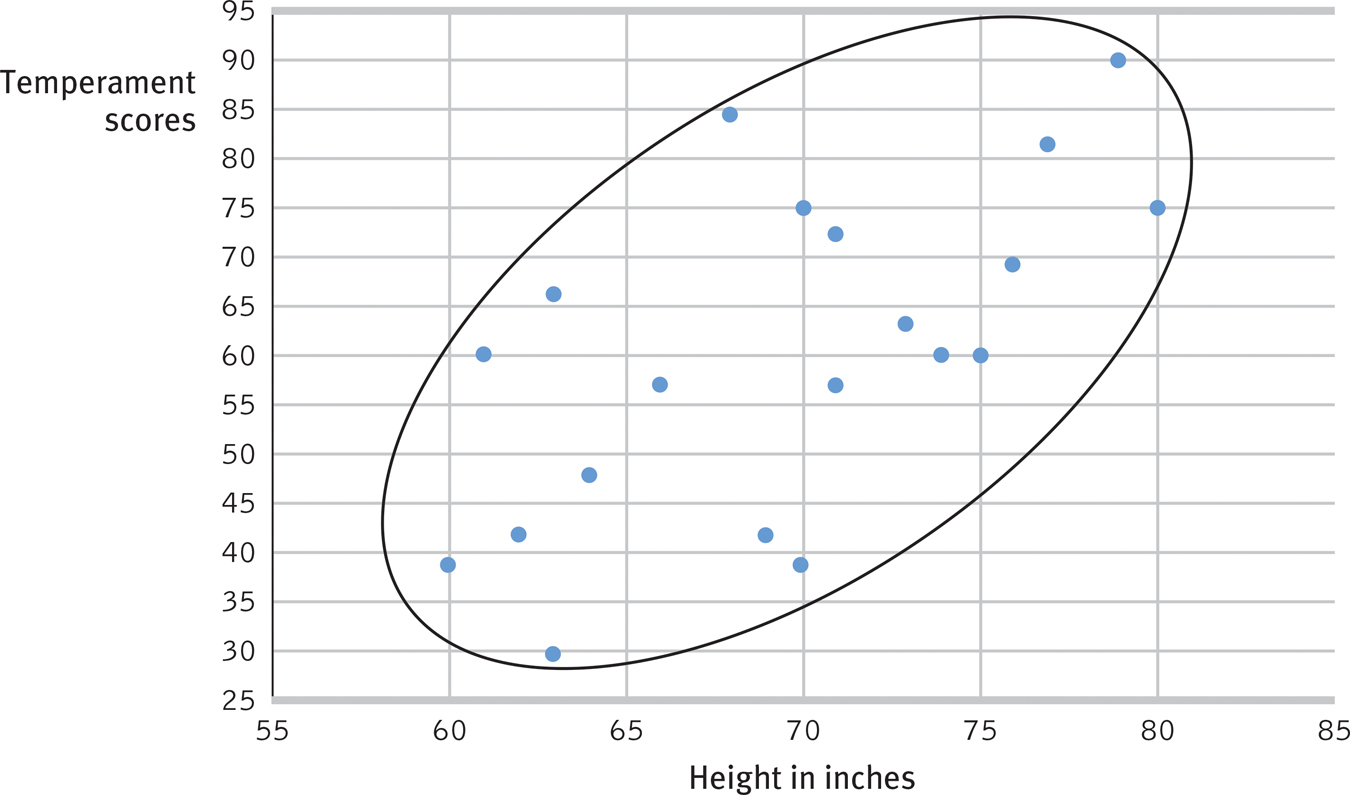
Scatterplot for height and reactive temperament This display of data from 20 imagined people (each represented by a data point) reveals an upward slope, indicating a positive correlation. The considerable scatter of the data indicates the correlation is much lower than +1.00.
If we fail to see a relationship when data are presented as systematically as in Table 3.2, how much less likely are we to notice them in everyday life? To see what is right in front of us, we sometimes need statistical illumination. We can easily see evidence of gender discrimination when given statistically summarized information about job level, seniority, performance, gender, and salary. But we often see no discrimination when the same information dribbles in, case by case (Twiss et al., 1989).
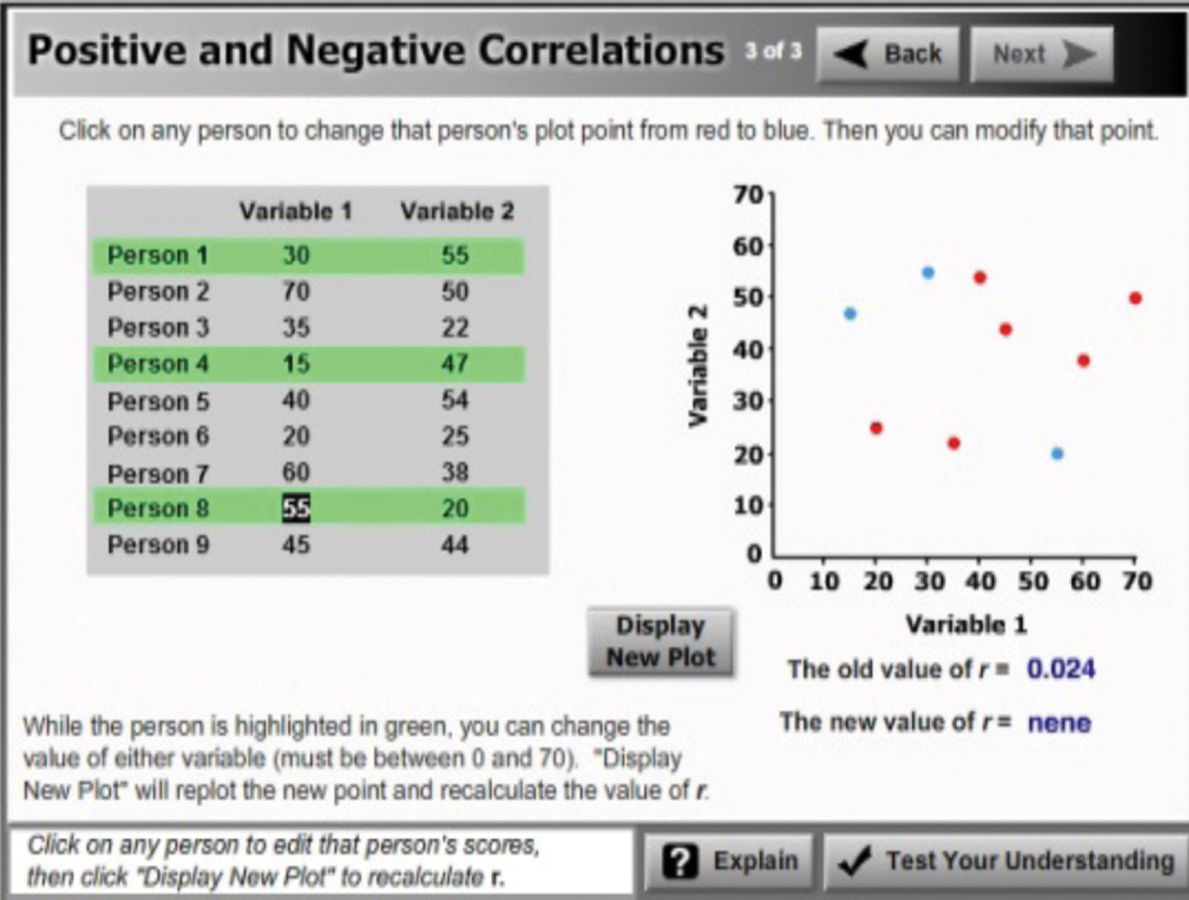
 For an animated tutorial on correlations, visit LaunchPad’s Concept Practice: Positive and Negative Correlations.
The point to remember: A correlation coefficient helps us see the world more clearly by revealing the extent to which two things relate.
RETRIEVAL PRACTICE
- Indicate whether each association is a positive correlation or a negative correlation.
- The more children and youth used various media, the less happy they were with their lives (Kaiser, 2010). __________
- The less sexual content teens saw on TV, the less likely they were to have sex (Collins et al., 2004). __________
- The longer children were breast-fed, the greater their later academic achievement (Horwood & Ferguson, 1998). __________
- The more income rose among a sample of poor families, the fewer psychiatric symptoms their children experienced (Costello et al., 2003). __________
1. negative, 2. positive, 3. positive, 4. negative
Regression Toward the Mean
3-
Correlations not only make visible the relationships we might otherwise miss, they also restrain our “seeing” nonexistent relationships. When we believe there is a relationship between two things, we are likely to notice and recall instances that confirm our belief. If we believe that dreams are forecasts of actual events, we may notice and recall confirming instances more than disconfirming instances. The result is an illusory correlation.
Illusory correlations feed an illusion of control—
The point may seem obvious, yet we regularly miss it: We sometimes attribute what may be a normal regression (the expected return to normal) to something we have done. Consider two examples:
- Students who score much lower or higher on an exam than they usually do are likely, when retested, to return to their average.
- Unusual ESP subjects who defy chance when first tested nearly always lose their “psychic powers” when retested (a phenomenon parapsychologists have called the decline effect).
Failure to recognize regression is the source of many superstitions and of some ineffective practices as well. When day-
The point to remember: When a fluctuating behavior returns to normal, there is no need to invent fancy explanations for why it does so. Regression toward the mean is probably at work.
“Once you become sensitized to it, you see regression everywhere.”
Psychologist Daniel Kahneman (1985)
RETRIEVAL PRACTICE
- You hear the school basketball coach telling her friend that she rescued her team’s winning streak by yelling at the players after an unusually bad first half. What is another explanation of why the team’s performance improved?
The team’s poor performance was not their typical behavior. Their return to their normal—
Correlation and Causation
3-
Consider some recent newsworthy correlations:
- “Study finds that increased parental support for college results in lower grades” (Jaschik, 2013).
- People with mental illness more likely to be smokers, study finds” (Belluck, 2013).
- “Teens who play mature-rated, risk-glorifying video games [tend] to become reckless drivers” (Bowen, 2012).
What shall we make of these correlations? Do they indicate that students would achieve more if their parents would support them less? That stopping smoking would improve mental health? That abstaining from video games would make reckless teen drivers more responsible?
RETRIEVAL PRACTICE
Correlation need not mean causation
- Length of marriage positively correlates with hair loss in men. Does this mean that marriage causes men to lose their hair (or that balding men make better husbands)?
In this case, as in many others, a third factor can explain the correlation: Golden anniversaries and baldness both accompany aging.

No, because such correlations do not come with built-
Another example: Self-
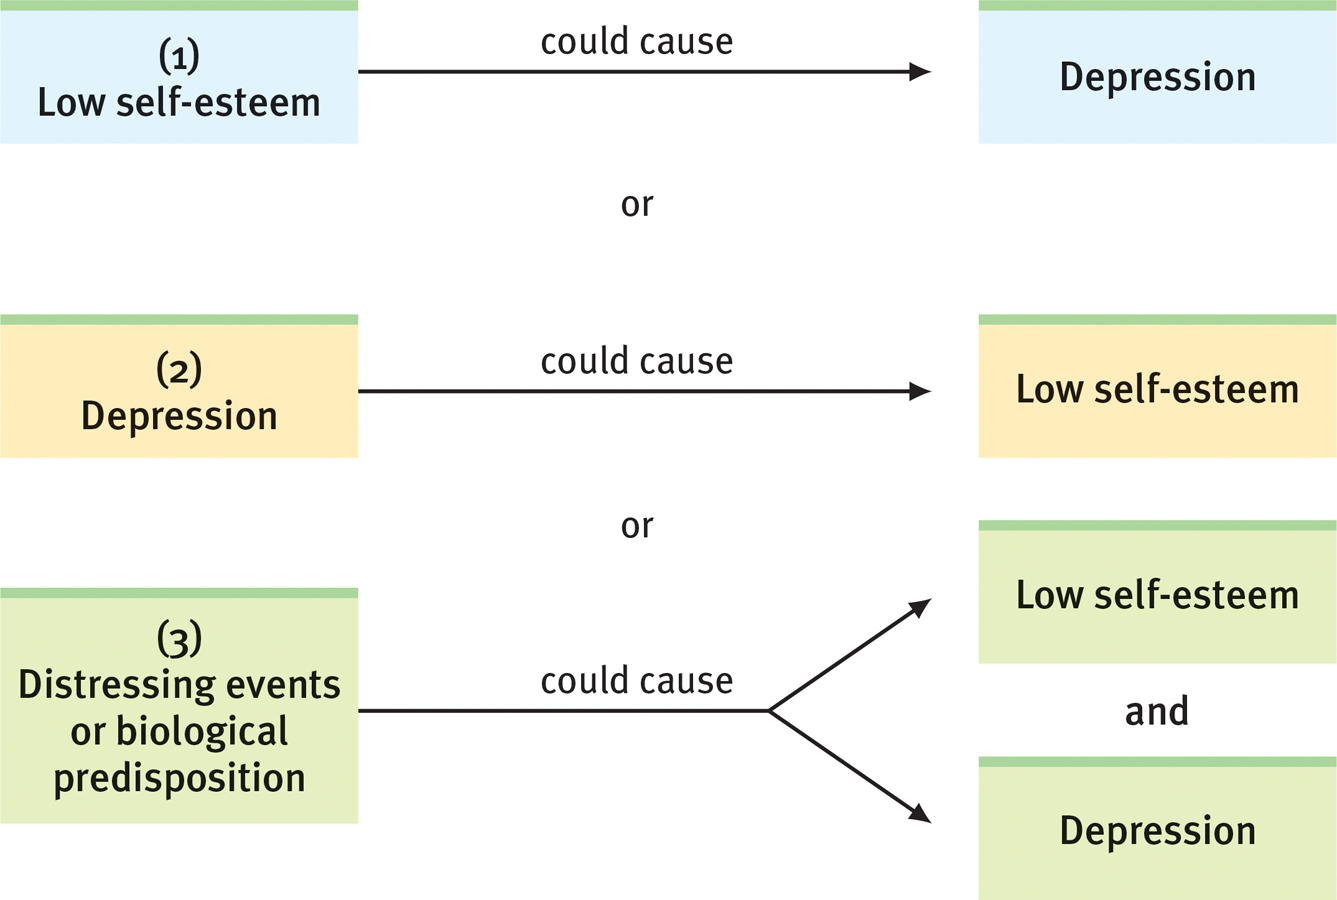
Three possible cause-
This point is so important—
The point to remember (turn the volume up here): Correlation does not prove causation.1 Correlation indicates the possibility of a cause-