6.1 The Tools of Discovery: Having Our Head Examined
6-
A century ago, scientists had no tools high powered yet gentle enough to explore the living human brain. Early case studies helped localize some brain functions. Damage to one side of the brain often caused numbness or paralysis on the body’s opposite side, suggesting that the body’s right side is wired to the brain’s left side, and vice versa. Damage to the back of the brain disrupted vision, and to the left-
Now, within a lifetime, a new generation of neural cartographers is probing and mapping the known universe’s most amazing organ. Scientists can selectively lesion (destroy) tiny clusters of brain cells, leaving the surrounding tissue unharmed. In the laboratory, such studies have revealed, for example, that damage to one area of the hypothalamus in a rat’s brain reduces eating, to the point of starvation, whereas damage in another area produces overeating.
Today’s neuroscientists can also stimulate various brain parts—
Right now, your mental activity is emitting telltale electrical, metabolic, and magnetic signals that would enable neuroscientists to observe your brain at work. Electrical activity in your brain’s billions of neurons sweeps in regular waves across its surface. An electroencephalogram (EEG) is an amplified readout of such waves. Researchers record the brain waves through a shower-
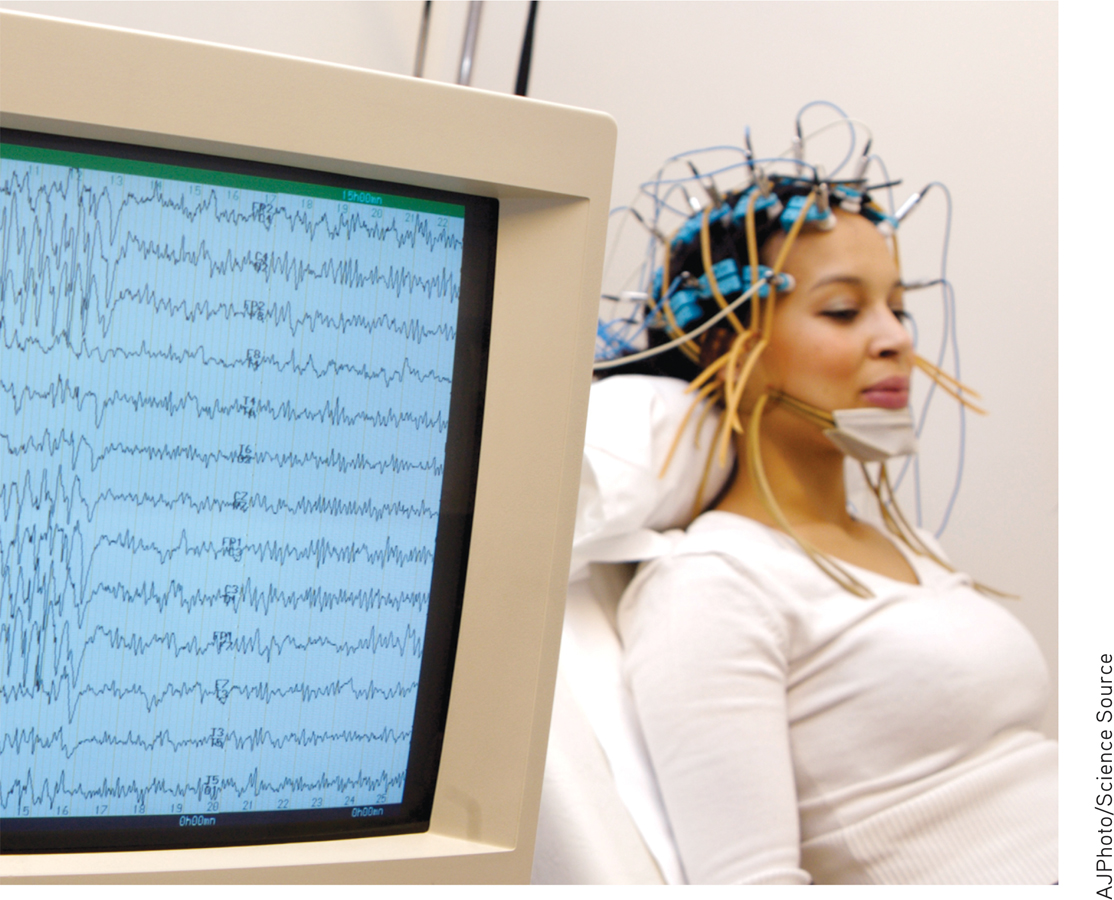
Brain hacking An electroencephalograph provides amplified tracings of waves of electrical activity in the brain.
“You must look into people, as well as at them,” advised Lord Chesterfield in a 1746 letter to his son. Unlike EEGs, newer neuroimaging techniques give us that Superman-
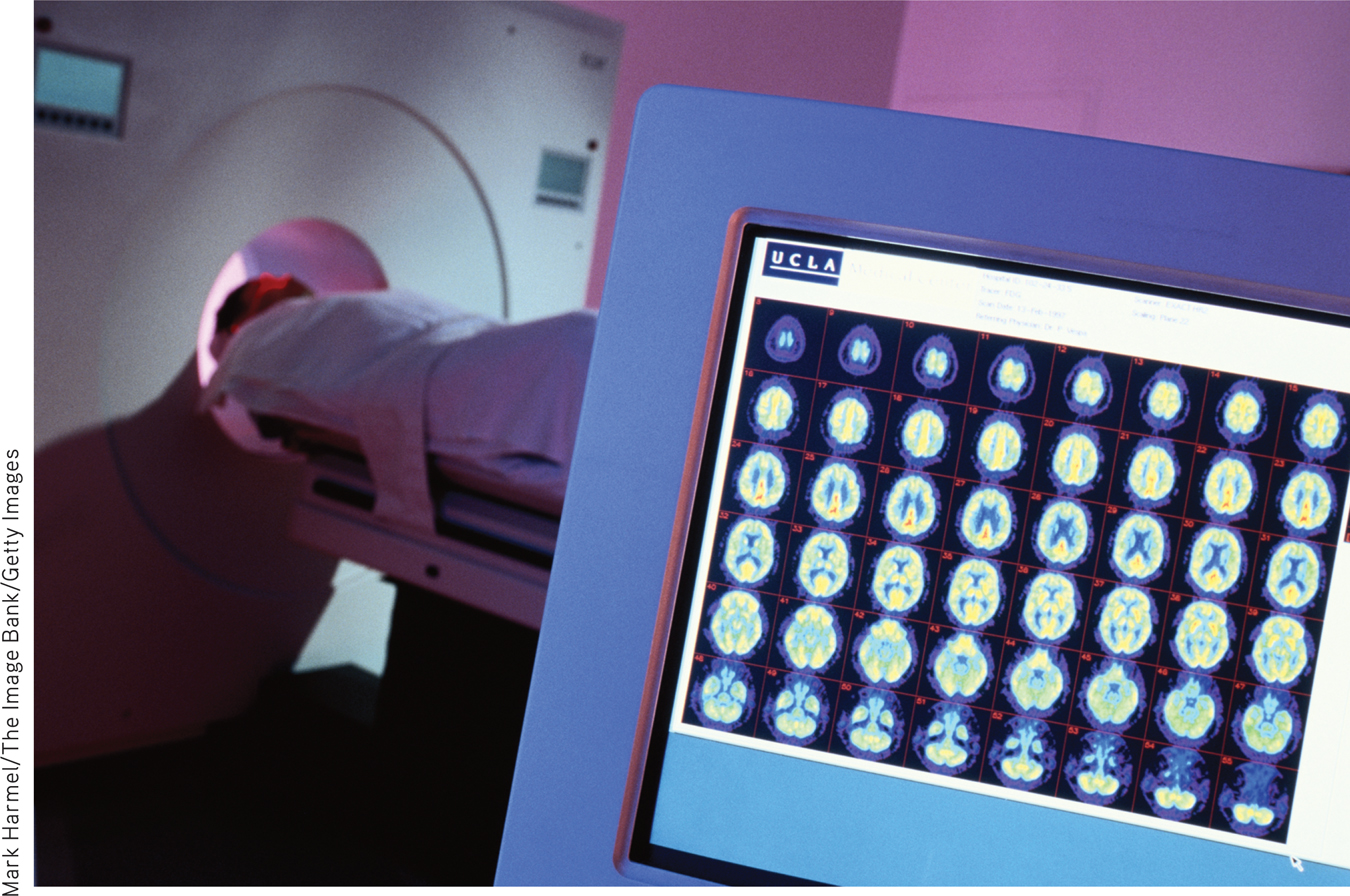
The PET scan To obtain a PET scan, researchers inject volunteers with a low and harmless dose of a short-
In MRI (magnetic resonance imaging) brain scans, the person’s head is put in a strong magnetic field, which aligns the spinning atoms of brain molecules. Then, a radio-
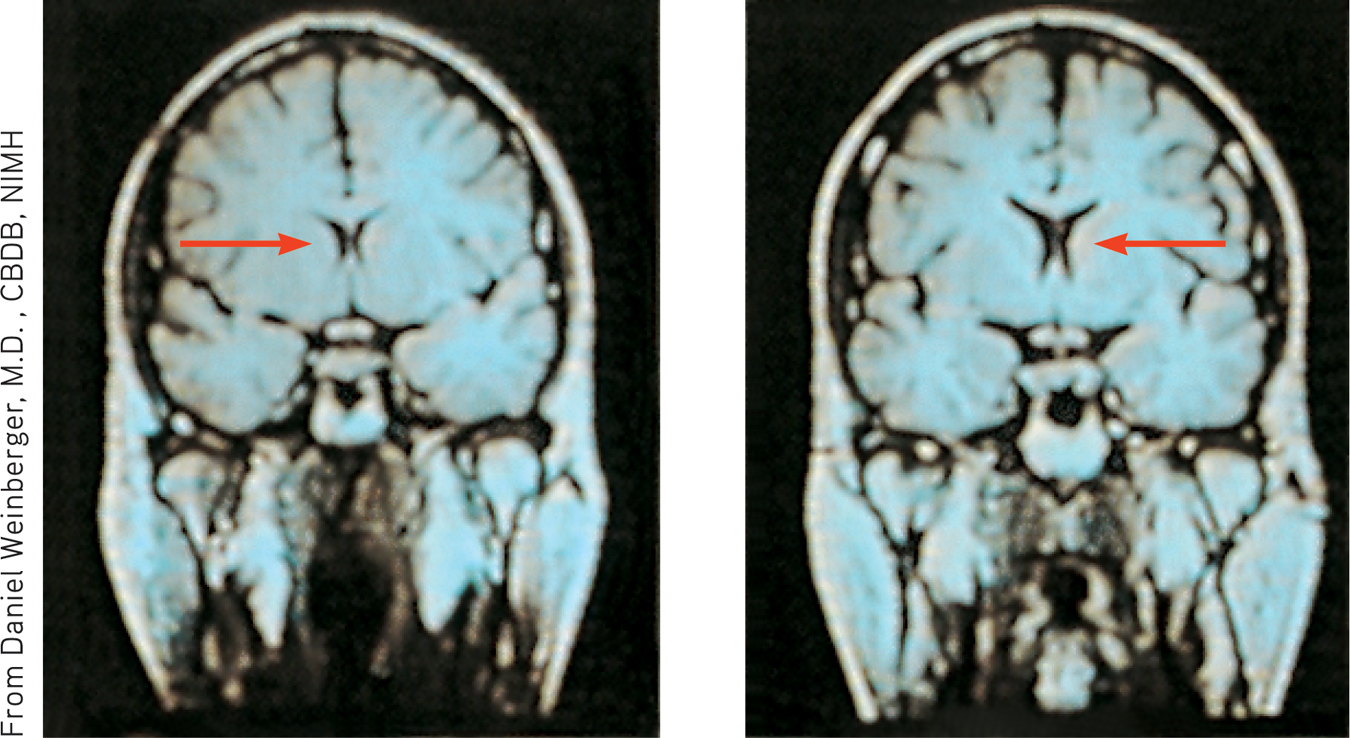
MRI scan of a healthy individual (left) and a person with schizophrenia (right) Note the enlarged ventricle, the fluid-
A special application of MRI—
Such snapshots of the brain’s changing activity are providing new insights into how the brain divides its labor. A mountain of recent fMRI studies suggests which brain areas are most active when people feel pain or rejection, listen to angry voices, think about scary things, feel happy, or become sexually excited. The technology enables a very crude sort of mind reading. One neuroscience team scanned 129 people’s brains as they did eight different mental tasks (such as reading, gambling, or rhyming). Later, they were able, with 80 percent accuracy, to predict which of these mental activities a person was doing (Poldrack et al., 2009). Other studies have explored brain activity associated with religious experience, though without settling the question of whether the brain is producing or perceiving God (Fingelkurts & Fingelkurts, 2009; Inzlicht et al., 2009; Kapogiannis et al., 2009).
You’ve seen the pictures—
***
Today’s techniques for peering into the thinking, feeling brain are doing for psychology what the microscope did for biology and the telescope did for astronomy. From them we have learned more about the brain in the last 30 years than in the previous 30,000. And the next decade will reveal much more, as each year massive funding goes into brain research. Europe’s Human Brain Project promises $1 billion for brain computer modeling and the $40 million Human Connectome Project (2013; Gorman, 2014) seeks “neural pathways [that] will reveal much about what makes us uniquely human and what makes every person different from all others.” A new super-
To be learning about the neurosciences now is like studying world geography while Magellan was exploring the seas. The whole brain mapping effort now underway has been likened to last century’s Apollo program that landed humans on the Moon, and to the Human Genome Project’s mapping our DNA. This truly is the golden age of brain science.
RETRIEVAL PRACTICE
- Match the scanning technique with the correct description.
| Technique | Description |
| 1. fMRI scan | a. tracks radioactive glucose to reveal brain activity. |
| 2. PET scan | b. tracks successive images of brain tissue to show brain function. |
| 3. MRI scan | c. uses magnetic fields and radio waves to show brain anatomy. |
1. b, 2. a, 3. c