FIGURE 10- 1
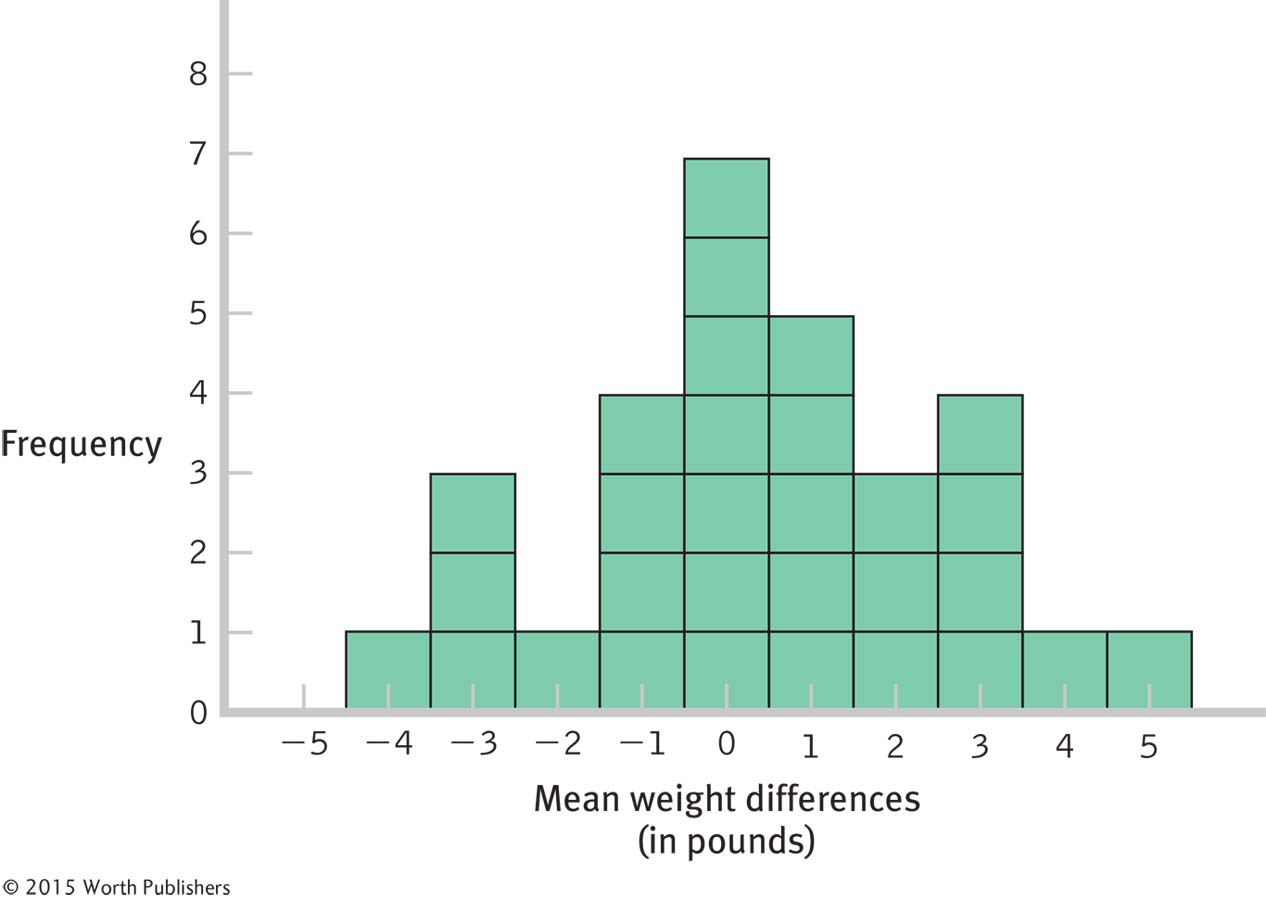
Distribution of Differences Between Means
This graph represents the beginning of the development of a distribution of differences between means. It includes only 30 differences, whereas the actual distribution would include all possible differences.
Distribution of Differences Between Means
This graph represents the beginning of the development of a distribution of differences between means. It includes only 30 differences, whereas the actual distribution would include all possible differences.