FIGURE 10-
A 95% Confidence Interval for Differences Between Means, Part I
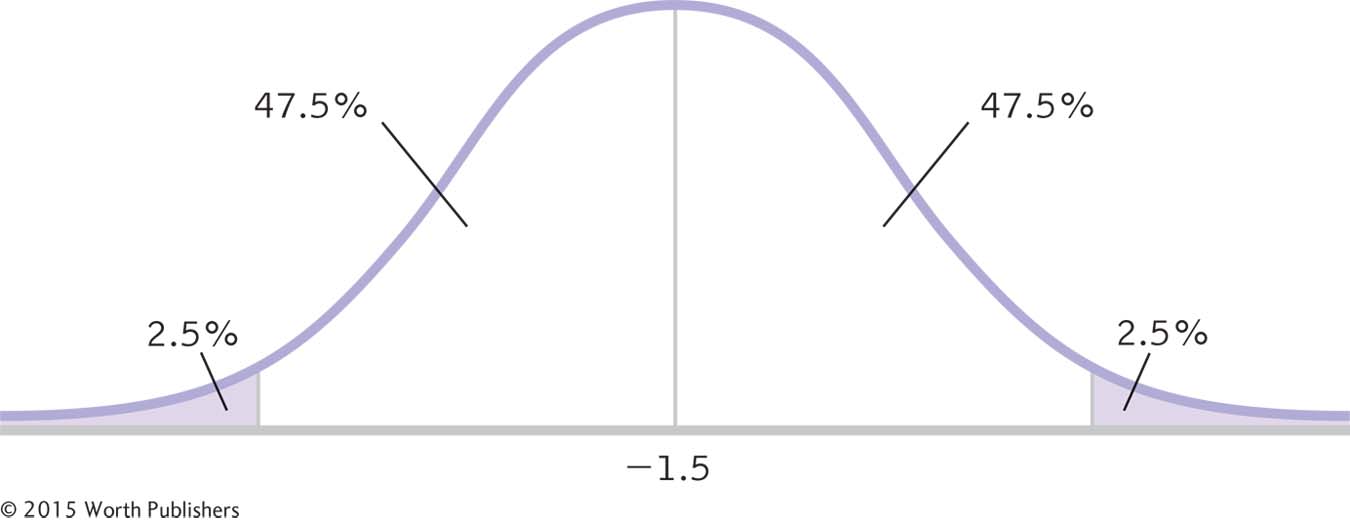
As with a confidence interval for a single-
A 95% Confidence Interval for Differences Between Means, Part I
As with a confidence interval for a singl