FIGURE 3-
Two Independent Variables
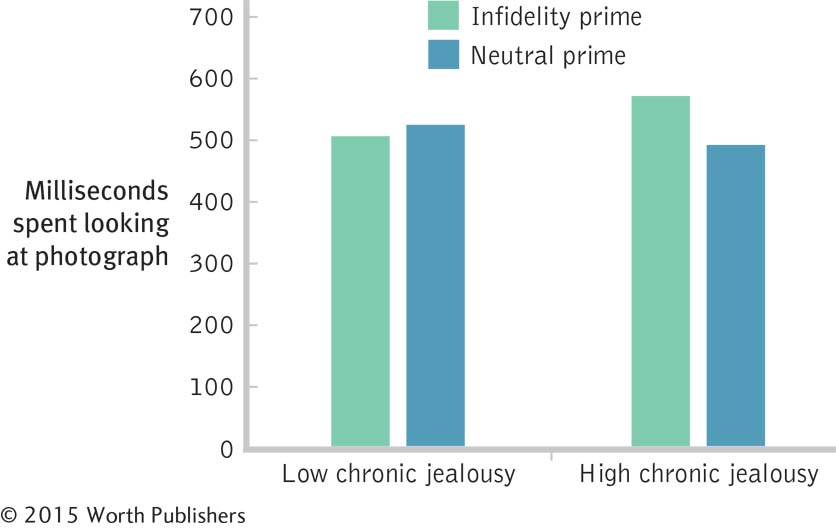
When graphing a data set that has two independent variables, show one independent variable on the x-axis (in this case, chronic jealousy— r- e—
Two Independent Variables
When graphing a data set that has two independent variables, show one independent variable on the x-axis (in this case, chronic jealous