FIGURE 4-
Estimating Central Tendency with Histograms
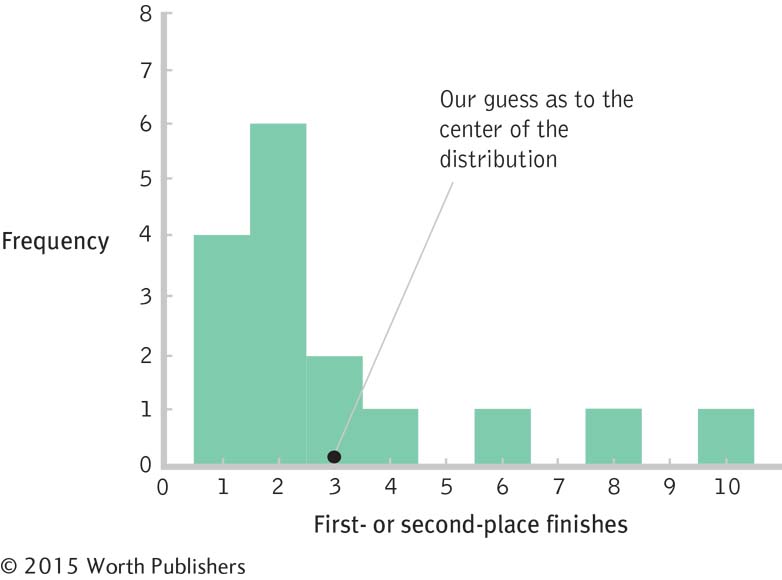
Histograms and frequency polygons allow us to see the likely center of a sample’s distribution. The arrow points to our guess as to the center of the distribution of World Cup top finishes.
Estimating Central Tendency with Histograms
Histograms and frequency polygons allow us to see the likely center of a sample’s distribution. The arrow points to our guess as to the center of the distribution of World Cup top finishes.