FIGURE 6-
The All-
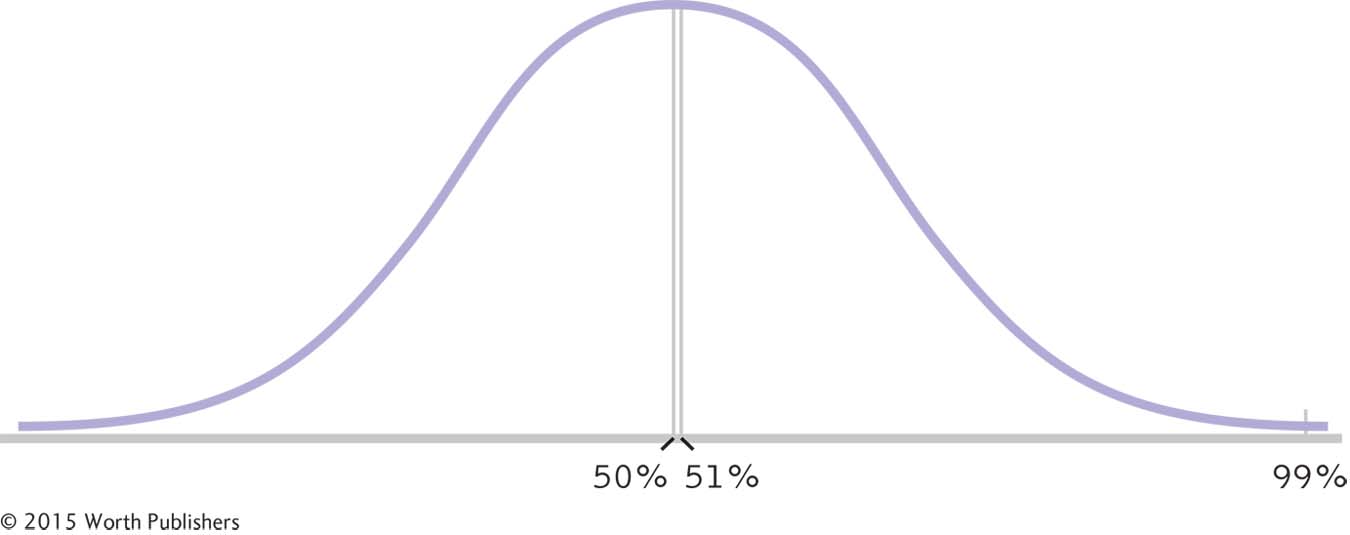
The z distribution theoretically includes all possible scores, so when it’s based on a normal distribution, we know that 50% of the scores are above the mean and 50% are below the mean. But the 51st percentile and the 99th percentile are still far from each other, so two people making a comparison usually want more precise information than whether or not they are above average.
The Al
The z distribution theoretically includes all possible scores, so when it’s based on a normal distribution, we know that 50% of the scores are above the mean and 50% are below the mean. But the 51st percentile and the 99th percentile are still far from each other, so two people making a comparison usually want more precise information than whether or not they are above average.