FIGURE 7-
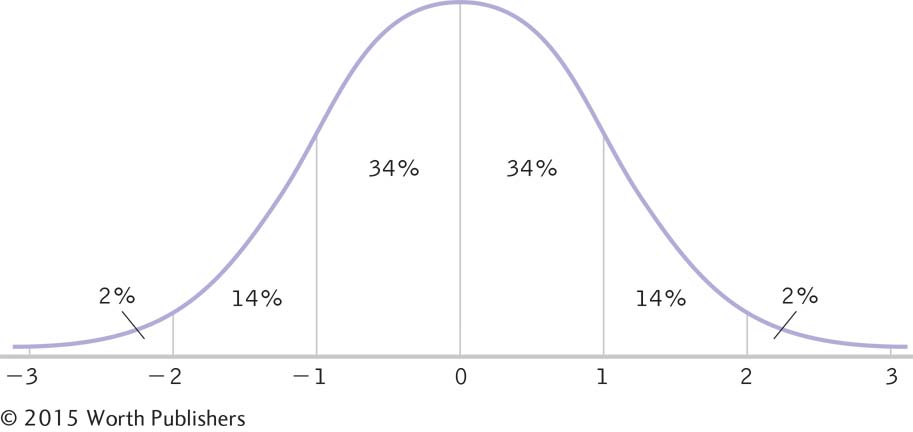
The Standardized z Distribution
We can use a z table to determine the percentages below and above a particular z score. For example, 34% of scores fall between the mean and a z score of 1.
The Standardized z Distribution
We can use a z table to determine the percentages below and above a particular z score. For example, 34% of scores fall between the mean and a z score of 1.