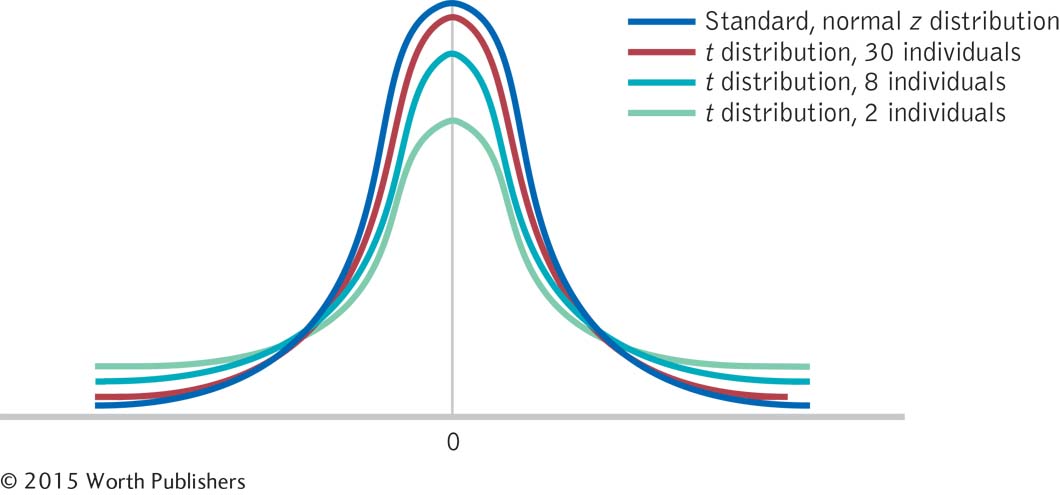
FIGURE 9-
The Wider and Flatter t Distributions
The Wider and Flatter t Distributions
For smaller samples (such as of 2 or 8 individuals), the t distributions are wider and flatter than the z distribution. However, as the sample size increases (such as of 30 individuals), the t distributions look more like the z distribution. This makes sense because a larger sample size would be more similar to the entire population than a smaller sample size.