FIGURE 9- 12
A 95% Confidence Interval for a Paired- Samples t Test, Part III
A 95% Confidence Interval for a Paire
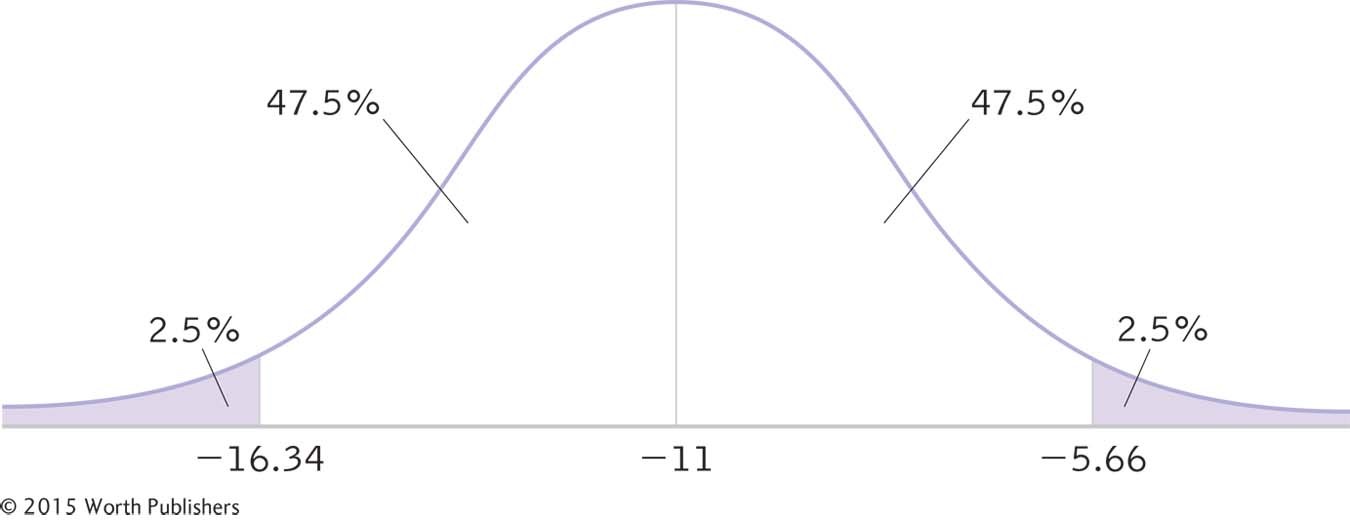
The final step in calculating a confidence interval for mean differences is converting the t statistics that indicate each end of the interval to raw mean differences, −16.34 and −5.66.