
Overview of Reporting Statistics
In Chapter 10, How It Works 10.1, we described a study about gender differences in humor (Azim, Mobbs, Jo, Menon, & Reiss, 2005). Let’s recap the results of the analyses and then use this information to report statistics in the Methods and Results sections of a paper written in the style of the American Psychological Association (APA). In the analyses of the humor data, we used fictional data that had the same means as the actual study by Azim and colleagues. We used the following raw data:
Percentage of cartoons labeled as “funny”
Women: 84, 97, 58, 90
Men: 88, 90, 52, 97, 86
We conducted an independent-
The statistics for this test, as reported in a journal article, would include the symbol for the statistic, the degrees of freedom, the value of the test statistic, and, for statistics calculated by hand, whether the p value associated with the test statistic was less than or greater than the cutoff p level of 0.05. In the humor example, the statistics would read:
t(7) = −0.03, p > 0.05
(Note that when we conducted this hypothesis test using SPSS, we got an exact p value of 0.977, so we would say p = 0.98 instead of p > 0.05 if we had used software.) In addition to the statistics, we also would report the means and standard deviations for the two samples:
Women: M = 82.25, SD = 17.02; Men: M = 82.60, SD = 18.13
We can also calculate that the percentage difference between women and men is 82.25 − 82.60 = −0.35. There is just a 0.35% difference between women and men.
In How It Works 10.3, we calculated a confidence interval for these data. The 95% confidence interval, centered around the difference between means of 82.25 − 82.60 = −0.35, is [−27.88, 27.18].
In How It Works 10.4, we calculated the effect size for this study, a Cohen’s d of −0.02. We now have sufficient information to write up these findings.
There are three topics to consider when reporting statistics, all covered in various sections of the Publication Manual of the American Psychological Association (APA, 2010):
In the Methods section, we justify the study by including information about the statistical power, reliability, and validity of any measures we used.
In the Results section, we report the traditional statistics, which include any relevant descriptive statistics and often the results of hypothesis testing.
In the Results section, we also report the newer statistics that are now required by the APA, including effect sizes and confidence intervals (APA, 2010).
Justifying the Study
To justify the study, we first report the results of the statistical power analyses that were conducted before the data were collected. Then we report any information related to the reliability and validity of the measured variables. This information usually goes in the Methods section of the paper.
To summarize this aspect of the findings, we include in the Methods section:
Statistical power analyses
Psychometric data for each scale used (reliability and validity information)
Reporting Traditional Statistics
The Results section should include any relevant summary statistics. For analyses with a scale dependent variable, include means, standard deviations, and sample sizes for each cell in the research design. For analyses with a nominal dependent variable (chi-
Summary statistics are sometimes presented first in a Results section but are more typically presented after a description of each hypothesis test. If there are only two or three cells, then the summary statistics are typically presented in the text; if there are more cells, then these statistics should be displayed in a table or figure.
Reports of hypothesis tests typically begin by reiterating the hypothesis to be tested and then describing the test that was conducted, including the independent and dependent variables. The results of the hypothesis test are then presented, usually including the symbol for the statistic, the degrees of freedom, the actual value of the statistic, and, if using software, the actual p value associated with that statistic. The format for reporting this information is included after each hypothesis test in this text and is presented again in Table F-1.
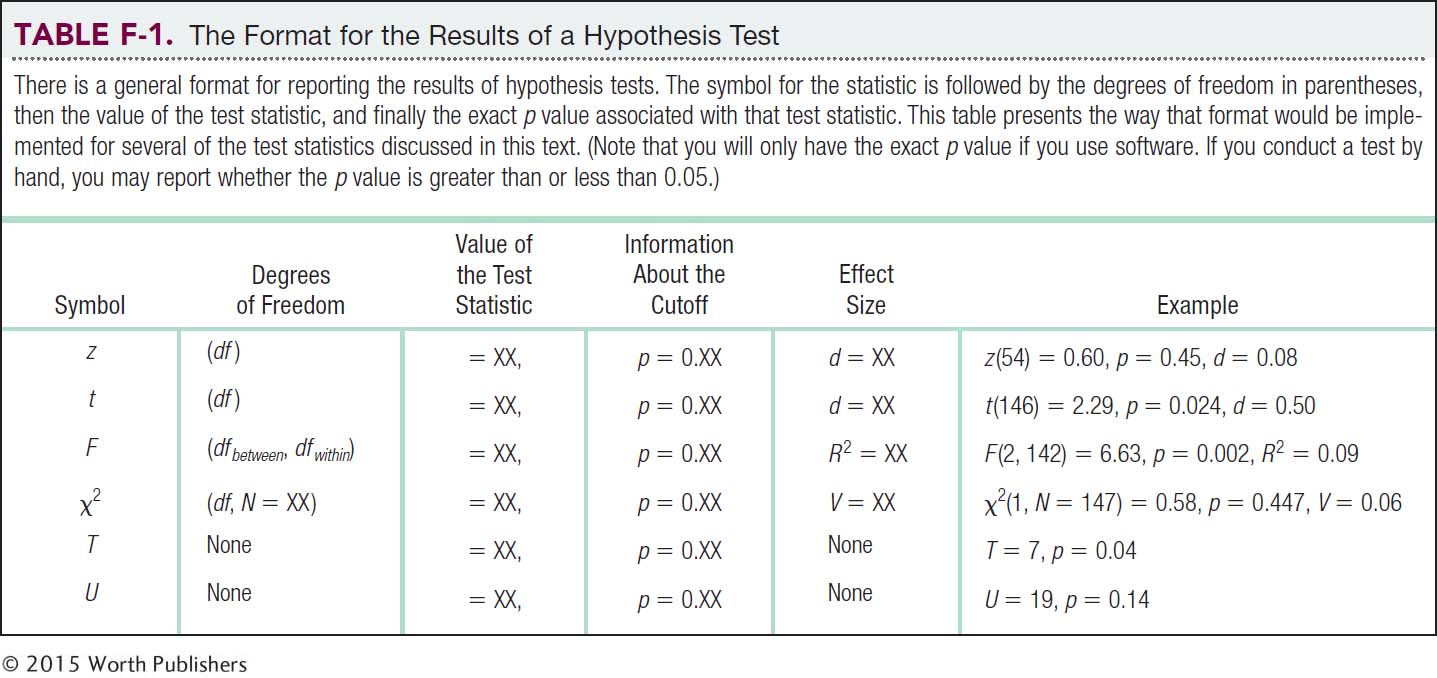
After the statistics are presented, a brief statement summarizes the results, indicating the direction of any effects. This brief statement does not draw conclusions beyond the actual finding. In the Results section, researchers do not discuss the finding in terms of the general theories in the field or in terms of its potential implications or applications (which go, appropriately enough, in the Discussion section). Researchers should present the results of all hypothesis tests that they conducted, even those in which they failed to reject the null hypothesis.
To summarize this aspect of Results sections:
Include summary statistics: means, standard deviations, and either sample sizes for each cell (when the dependent variable is scale) or frequencies (counts) for each cell (when the dependent variable is nominal). These are often included after each hypothesis test.
For each hypothesis test conducted:
Include a brief summary of the hypotheses and hypothesis test.
Report the results of hypothesis testing: the symbol for the statistic used, the degrees of freedom, the actual value of the statistic, and the p value associated with this statistic (if using software).
Provide a statement that summarizes the results of the hypothesis testing.
Use tables and figures to clarify patterns in the findings.
Include all results, even for findings that are not statistically significant.
The statistics for the study from How It Works in Chapter 10 that compared the mean percentages of cartoons that women and men found funny might be reported as follows:
To examine the hypothesis that women and men, on average, find different percentages of cartoons funny, we conducted an independent-
Reporting Newer Statistics
It is no longer enough to simply present the descriptive statistics and the results of the hypothesis test. As of the 2010 edition of its Publication Manual, the APA requires that effect sizes and confidence intervals be included when relevant. The effect-
To summarize this aspect of the Results sections, we include:
Effect size, along with a statement about the size of the effect.
Confidence intervals when possible, along with a statement interpreting the confidence interval in the context of the study.
For the study on humor, we might report the effect size as part of the traditional statistics that we described above: There was not a statistically significant effect of gender, t(7) = −0.03, p = 0.98, d = −0.02, 95% CI [−28.37, 27.67]; this was a small, almost nonexistent, effect. In fact, there is only a 0.35% difference between the mean percentages for women and men. This study does not provide evidence that men and women, on average, rate different percentages of cartoons as funny.
For the humor study, we can now pull the parts together. Here is how the results would be reported:
To examine the hypothesis that women and men, on average, find different percentages of cartoons funny, we conducted an independent-
Based on the hypothesis test and the confidence interval, this study does not provide evidence that women (M = 82.25, SD = 17.02) and men (M = 82.60, SD = 18.13) deem, on average, different percentages of cartoons to be funny. In fact, there is only a very small difference between the mean percentages for women and men, just 0.35%.