How It Works
13.1 UNDERSTANDING CORRELATION COEFFICIENTS
A researcher gathered data on psychology students’ ratings of their likelihood of attending graduate school and the numbers of credits they had completed in their psychology major (Rajecki, Lauer, & Metzner, 1998). Imagine that each of the following numbers represents the Pearson correlation coefficient that quantifies the relation between these two variables. From each coefficient, what do we know about the relation between the two variables?
1.00: This correlation coefficient reflects a perfect positive relation between students’ ratings of the likelihood of attending graduate school and the number of psychology credits they completed. This correlation is the strongest correlation of the six options.
−0.001: This correlation coefficient reflects a lack of relation between students’ ratings and the number of psychology credits they completed. This is the weakest correlation of the six options.
0.56: This correlation coefficient reflects a large positive relation between students’ ratings and the number of completed psychology credits.
−0.27: This coefficient reflects a medium negative relation between students’ ratings and the number of completed psychology credits. (Note: This is the actual correlation between these variables found in the study.)
−0.98: This coefficient reflects a large (close to perfect) negative relation between students’ ratings and the number of psychology credits they have completed.
0.09: This coefficient reflects a small positive relation between students’ ratings and the number of completed psychology credits.
13.2 CALCULATING THE PEARSON CORRELATION COEFFICIENT
13.2 CALCULATING THE PEARSON CORRELATION COEFFICIENT
Is age associated with how much people study? How can we calculate the Pearson correlation coefficient for the accompanying data (taken from students in some of our statistics classes)?
| Student | Age | Number of Hours Studied per Week | Student | Age | Number of Hours Studied per Week |
| 1 | 19 | 5 | 6 | 23 | 25 |
| 2 | 20 | 20 | 7 | 22 | 15 |
| 3 | 20 | 8 | 8 | 20 | 10 |
| 4 | 21 | 12 | 9 | 19 | 14 |
| 5 | 21 | 18 | 10 | 25 | 15 |
Step 1: First, construct a scatterplot:
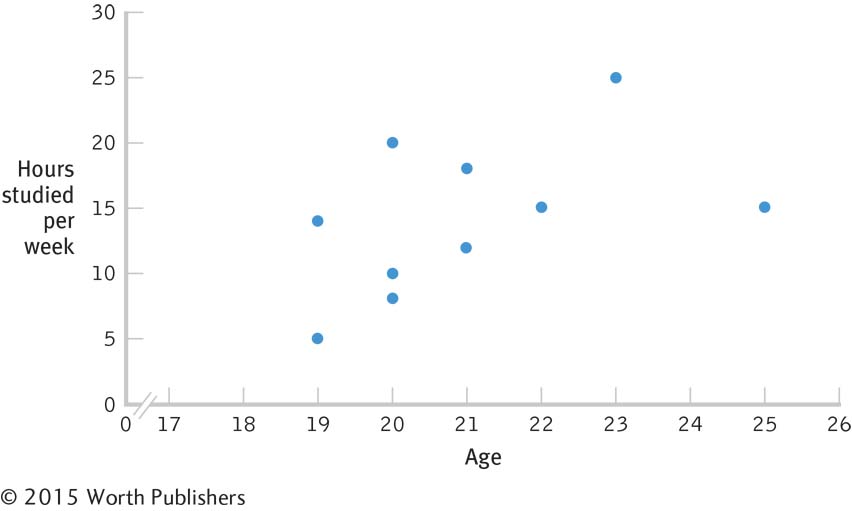
We see from the scatterplot that the data, overall, have a pattern through which we could imagine drawing a straight line. So, it is safe to calculate the Pearson correlation coefficient.
Step 2: Next, calculate the numerator of the Pearson correlation coefficient. The numerator is the sum of the product of the deviations for each variable. The mean for age is 21, and the mean for hours studied is 14.2. We use these means to calculate each score’s deviation from its mean. We then multiply the deviations for each student’s two scores and sum the products of the deviations. Here are the calculations:
| Age (X) | (X – MX) | Hours studied (Y) | (Y – MY) | (X – MX)(Y – MY) |
| 19 | −2 | 5 | −9.2 | 18.4 |
| 20 | −1 | 20 | 5.8 | −5.8 |
| 20 | −1 | 8 | −6.2 | 6.2 |
| 21 | 0 | 12 | −2.2 | 0 |
| 21 | 0 | 18 | 3.8 | 0 |
| 23 | 2 | 25 | 10.8 | 21.6 |
| 22 | 1 | 15 | 0.8 | 0.8 |
| 20 | −1 | 10 | −4.2 | 4.2 |
| 19 | −2 | 14 | −0.2 | 0.4 |
| 25 | 4 | 15 | 0.8 | 3.2 |
| MX = 21 | MY = 14.2 | Σ[(X − MX )(Y − MY)] = 49.0 |
The numerator is 49.0.
Step 3: Calculate the denominator of the Pearson correlation coefficient. The denominator is the square root of the product of the two sums of squares. We first calculate a sum of squares for each variable. The calculations are here:
| Age (X) | (X – MX) | (X – MX)2 | Hours studied (Y) | (Y – MY) | (Y – MY)2 |
| 19 | −2 | 4 | 5 | −9.2 | 84.64 |
| 20 | −1 | 1 | 20 | 5.8 | 33.64 |
| 20 | −1 | 1 | 8 | −6.2 | 38.44 |
| 21 | 0 | 0 | 12 | −2.2 | 4.84 |
| 21 | 0 | 0 | 18 | 3.8 | 14.44 |
| 23 | 2 | 4 | 25 | 10.8 | 116.64 |
| 22 | 1 | 1 | 15 | 0.8 | 0.64 |
| 20 | −1 | 1 | 10 | −4.2 | 17.64 |
| 19 | −2 | 4 | 14 | −0.2 | 0.04 |
| 25 | 4 | 16 | 15 | 0.8 | 0.64 |
| MX = 21 | Σ(X − MX )2 = 32 | MY = 14.2 | Σ(Y − MY)2 = 311.6 |
We now multiply the two sums of squares, then take the square root of the product of the sums of squares.

Step 4: Finally, we can put the numerator and denominator together to calculate the Pearson correlation coefficient:
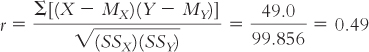
Now that we have calculated the Pearson correlation coefficient (0.49), we determine what the statistic tells us about the direction and the strength of the association between the two variables (age and number of hours studied). This is a positive correlation. Higher ages tend to be associated with longer hours spent studying, and lower ages tend to be associated with fewer hours spent studying.