15.5 SPSS®
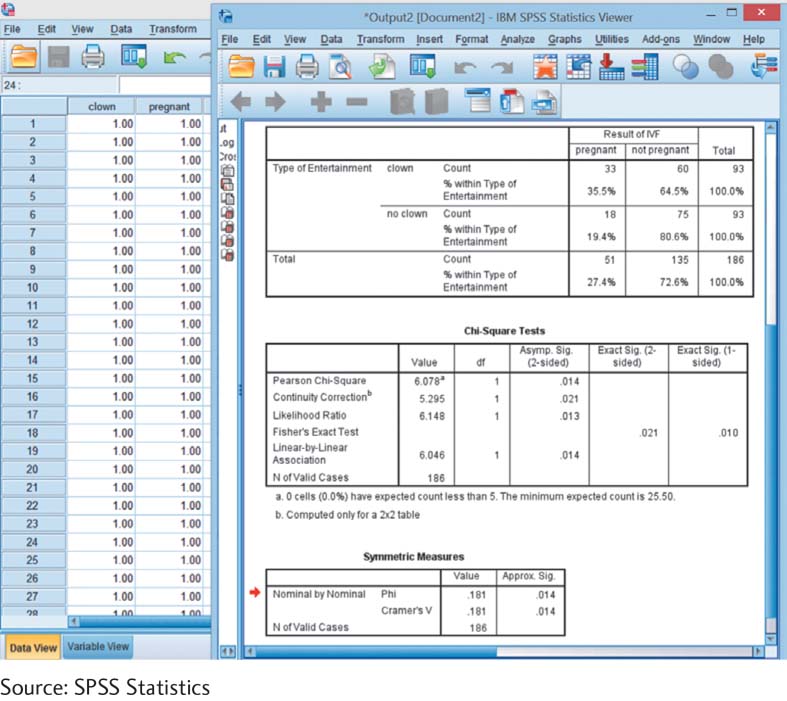
In SPSS, we conduct a chi-square test for independence by first entering the data. Each participant gets a score on each variable. For the pregnancy and clown entertainment data, there are two columns: one for a woman’s status with respect to entertainment by a clown (yes or no) and another for her pregnancy status (yes or no). We can use the numbers 1 and 2 to represent the levels of these variables. Select: Analyze → Descriptive Statistics → Crosstabs (select a nominal variable for the row and a nominal variable for the column; we selected entertainment-by-clown status for the rows and pregnancy status for the columns, but it doesn’t matter which we choose) → Statistics → Chi-Square and Phi & Cramér’s V (for effect sizes) → Continue. Select “Cells” and then click “Row” under percentages to get the percentage of women who became pregnant in each clown condition. Click “Continue,” and then click “OK” to run the analysis.
Most of the output, along with a view of some of the data, can be seen in the accompanying screenshot. In the top box of the output, we can see the percentages of women who did or did not become pregnant in each condition. For example, 35.5% of women who were entertained by a clown became pregnant. We can also see that the chi-square statistic (in the box titled “Chi-Square Tests” in the row labeled “Pearson Chi-Square”) is 6.078, the same as the one we calculated by hand earlier. In the box titled “Symmetric Measures,” we can see the Cramér’s V statistic of .181, also the same as we calculated earlier. (Any slight differences we see in this table versus what we calculated earlier are due to rounding decisions.)
Source: SPSS Statistics
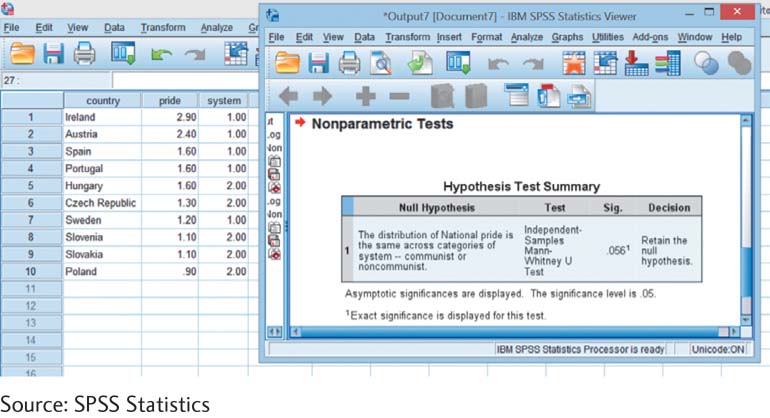
Let’s conduct a Mann–Whitney U test on the data we used when comparing communist and noncommunist countries on accomplishment-related pride. In SPSS, we conduct a Mann–Whitney U test by selecting: Analyze → Nonparametric Tests → 2 Independent-Samples Tests. Select “Mann–Whitney U” as the test type. Remember to select “Descriptive” under “Options” to display the descriptive data. The dependent variable, rankings on accomplishment-related national pride, goes under “Test Variable List,” and the independent variable, political system (noncommunist versus communist), goes under “Grouping Variable.” Be sure to define the groups by clicking “Define Groups” and telling SPSS what you have called each of the conditions (e.g., 1 and 2 for noncommunist and communist, respectively). The output will give us the same value for the Mann–Whitney U statistic, 3, that we calculated earlier. (Note: You may enter either scale or ordinal data as the dependent variable. SPSS automatically ranks the data. If the data are already ranked, no change is made to the values. If the data are scale, they are converted to ranks.)
Page 460
Source: SPSS Statistics