Chapter 8 Introduction
185
CHAPTER 8
Confidence Intervals, Effect Size, and Statistical Power
Confidence Intervals
Interval Estimates
Calculating Confidence Intervals with z Distributions
Effect Size
The Effect of Sample Size on Statistical Significance
What Effect Size Is
Cohen’s d
Meta-
Statistical Power
The Importance of Statistical Power
Five Factors That Affect Statistical Power
BEFORE YOU GO ON
You should know how to conduct a z test (Chapter 7).
You should understand the concept of statistical significance (Chapter 7).

186
“Want to go shopping? OK, meet me at the mall.” “Math class is tough.”
With these and 268 other phrases, Teen Talk Barbie was introduced to the market in July 1992. By September, it was being publicly criticized for its negative message about girls and math. At first the Mattel toy company refused to pull it from store shelves, citing more positive phrases in Barbie’s repertoire, such as “I’m studying to be a doctor.” But the bad press escalated, and by October Mattel had backed down. The controversy endured, however, and even showed up in a 1994 Simpsons episode when Lisa Simpson boycotted the fictional Malibu Stacy doll that had been programmed to say, “Thinking too much gives you wrinkles.”
The controversy over gender differences in mathematical reasoning ability began after a study on the topic was published in the prestigious journal Science. Participants included about 10,000 male and female students in grades 7 through 10 who were already among the top 2% to 3% on standardized tests of mathematics (Benbow & Stanley, 1980). In this preselected sample, the boys’ average score on the mathematics portion of the SAT test was 32 points higher than the girls’ average score, a statistically significant difference that gained vast media attention (Jacob & Eccles, 1982). But the danger of reporting such a mean difference is the implication that all or most of the members of one group are different from all or most of the members of the other group. As we see from the overlapping distributions in Figure 8-1, such an assertion is far from the truth.
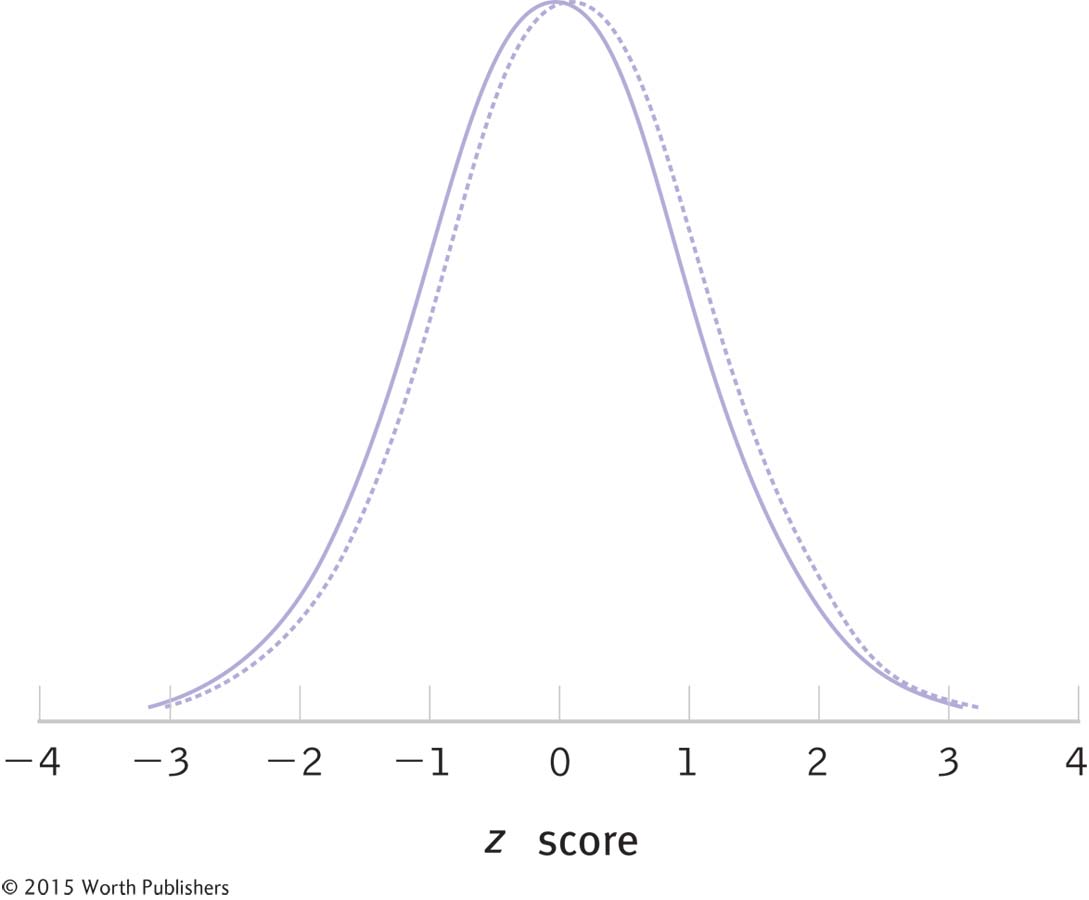
A Gender Difference in Mathematics Performance
This graph represents the overlap in mathematical performance that would be expected if distributions for males and females differed, on average, by the amount that Hyde and colleagues (1990) reported in their meta-
Language Alert! Part of this misunderstanding is caused by the language of statistics: “Statistically significant” does not mean “very important.” The misunderstanding about Benbow and Stanley’s study (1980) spread from researchers to the media to the general public. The issue gained even more attention when the release of Teen Talk Barbie inspired members of a guerrilla art group. The Barbie Liberation Organization switched the computer chips in talking Barbies and GI Joes and returned them to store shelves. Suddenly, GI Joe was chirping, in a voice uncannily like Barbie’s, “Let’s plan a great big wedding,” as well as complaining that “Math class is tough.”
187
It took a meta-
The two distributions (one for males; another for females) overlapped almost completely (see Figure 8-1). The dotted-
line curve represents male mathematical reasoning ability, and the solid- line curve represents female math reasoning ability. Mean gender differences in overall mathematical reasoning ability were small.
The difference was smaller and reversed (favoring women and girls rather than men and boys) when the extreme tails of the distribution were eliminated (such as scores from participants in remedial or gifted programs).
Are you surprised that a small (but statistically significant) gender difference is almost completely overlapping? This is a case in which hypothesis testing alone inadvertently encouraged a profound misunderstanding (?Jacob & Eccles, 1986). Fortunately, statisticians have developed three ways to move beyond these flaws in hypothesis testing. First, we compute confidence intervals, which provide a range of plausible mean differences. Second, we calculate effect sizes, which indicate the size of differences. Finally, we estimate the statistical power of the study to be sure that we have a sufficient sample size to detect a real difference. If we discover that we don’t have enough statistical power, then we need to increase statistical power so that we can believe the results of our own study.
It is increasingly expected by journal editors that researchers will include these methods in their reports of research (Cumming, 2013; Funder et al., 2013). Moreover, researchers are increasingly complying. For example, in one major journal within the last several years, 94% of studies reported effect sizes and 40% reported confidence intervals (Odgaard & Fowler, 2010).