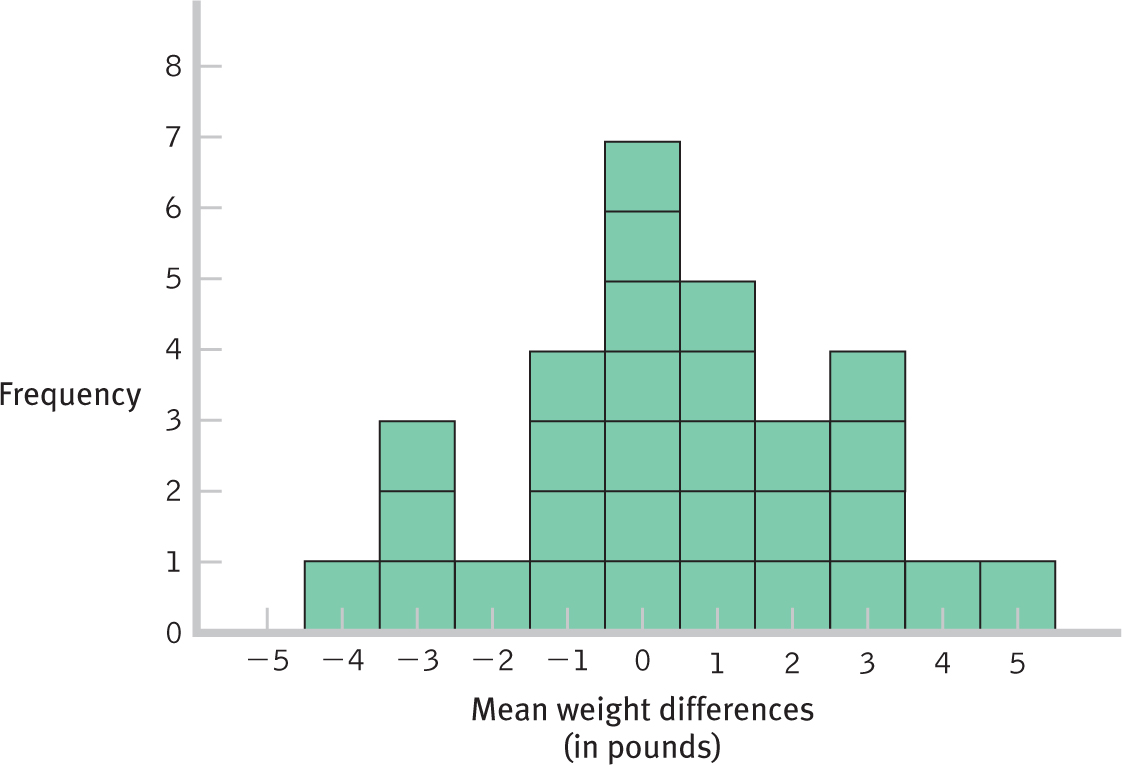
Creating a Distribution of Mean Differences This distribution is one of many that could be created by pulling 30 mean differences, the average of three differences between pairs of weights, pulled one at a time from a population of pairs of weights—one preholiday and one postholiday. The population used here is one based on the null hypothesis—that there is no average difference in weight from before the holidays to after the holidays.