Figure 1
0-
4
A 95% Confidence Interval for a Paire
d-
Samples
t
Test, Part I
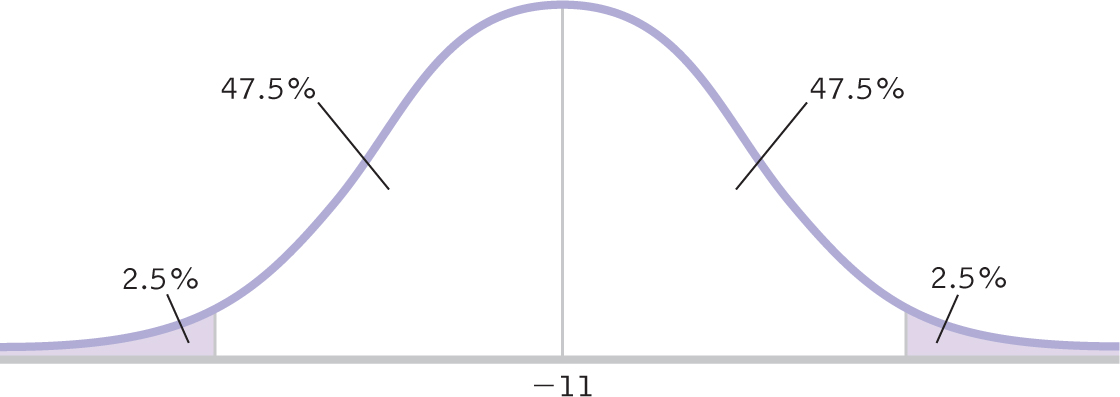
We start the confidence interval for a distribution of mean differences by drawing a curve with the sample mean difference, −11, in the center.