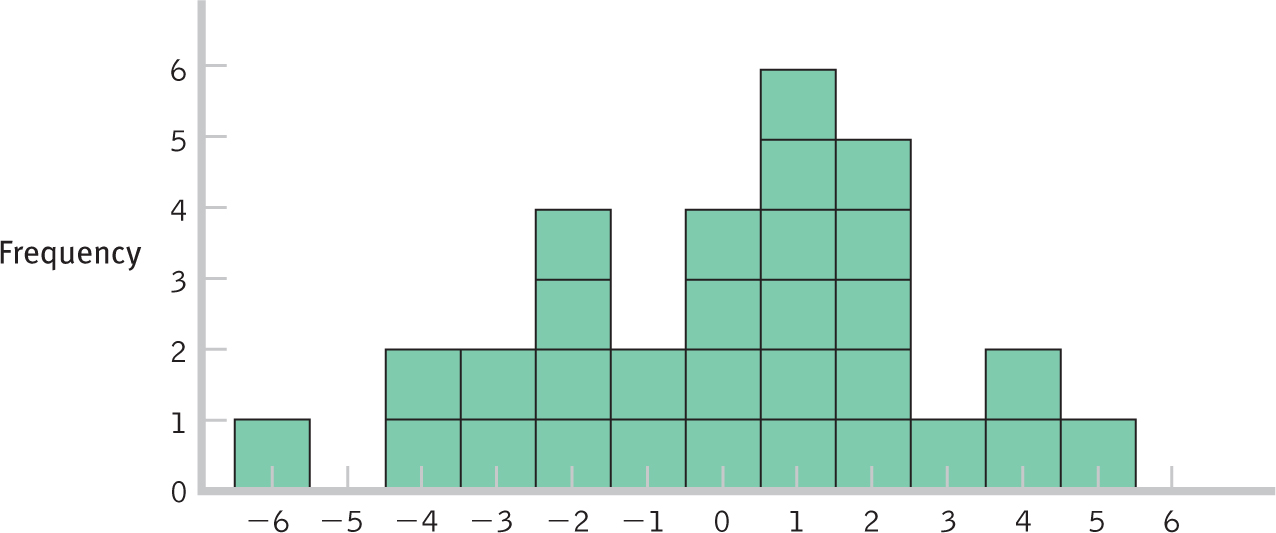
Figure 11-1
Distribution of Differences Between Means This curve represents the beginning of the development of a distribution of differences between means. It includes only 30 differences, whereas the actual distribution would include all possible differences.