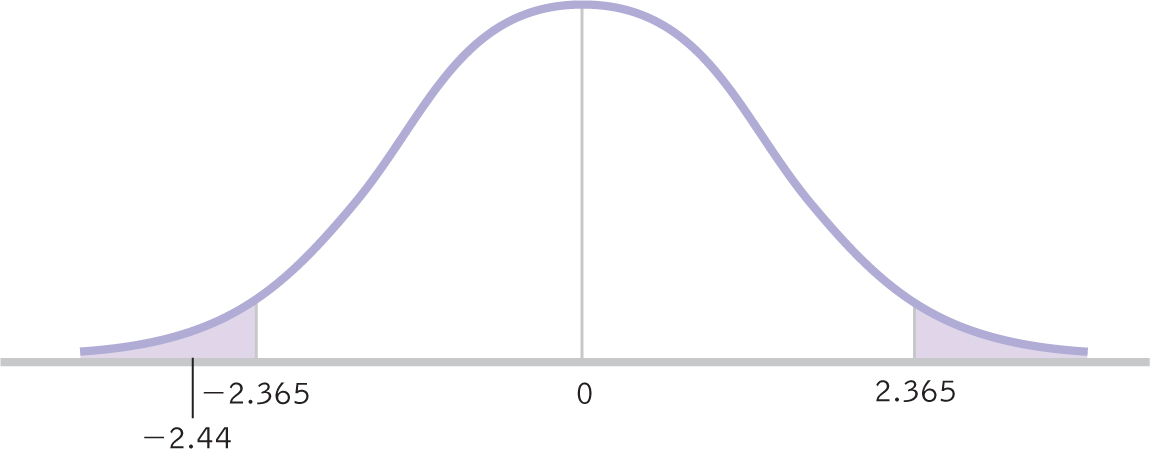
Figure 11-3
Making a Decision As in previous t tests, in order to decide whether or not to reject the null hypothesis, we compare the test statistic to the critical values. In this figure, the test statistic, −2.44, is beyond the lower cutoff, −2.365. We reject the null hypothesis. It appears that those told they are drinking wine from a $10 bottle give it lower ratings, on average, than those told they are drinking wine from a $90 bottle.