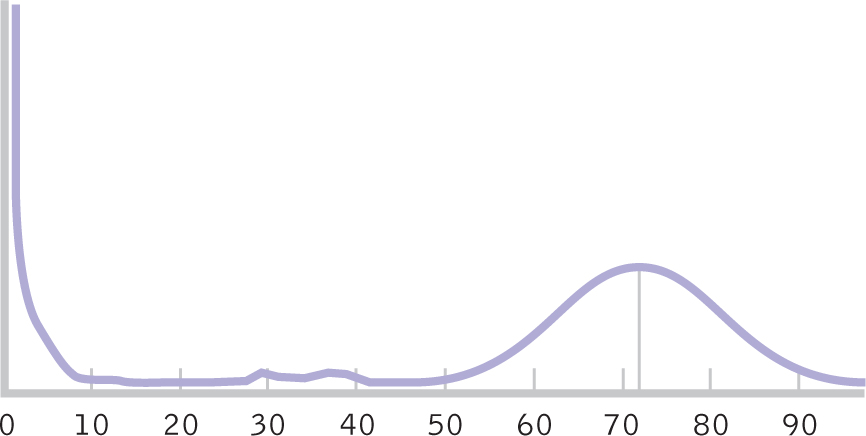
A Distribution of Mortality Mortality data create an unavoidably nonnormal distribution because of the many infants who die at or shortly after birth and the smaller number of people who die from ages 10 to 50. Mortality data create a normal distribution only if we look at the upper ages, as shown in this reproduction of an early graph by Lexis (1903, quoted by Stigler, 1986).