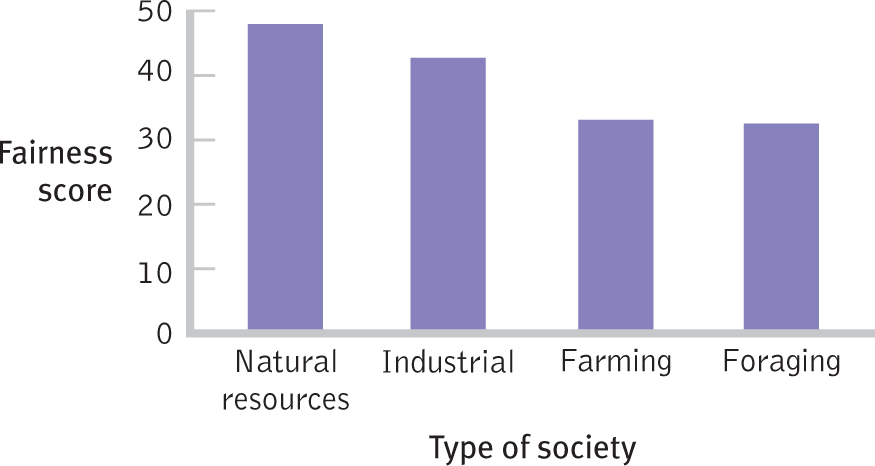
Figure 12-5
Which Types of Societies Are Different in Terms of Fairness? This graph depicts the mean fairness scores of people living in each of four different types of societies. When we conduct an ANOVA and reject the null hypothesis, we only know that there is a difference somewhere; we do not know where the difference lies. We can see several possible combinations of differences by examining the means on this graph. A post hoc test will let us know which specific pairs of means are different from one another.