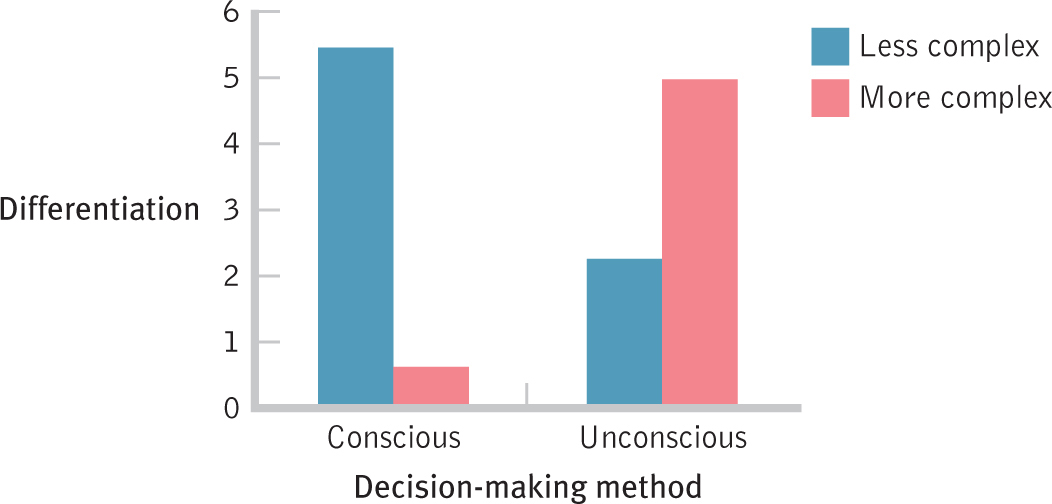
Graphing Decision-Making Methods This bar graph displays the interaction far better than a table or words. We can see that it is a qualitative interaction; there is an actual reversal of direction of the effect of decision-making method in less complex versus more complex situations.