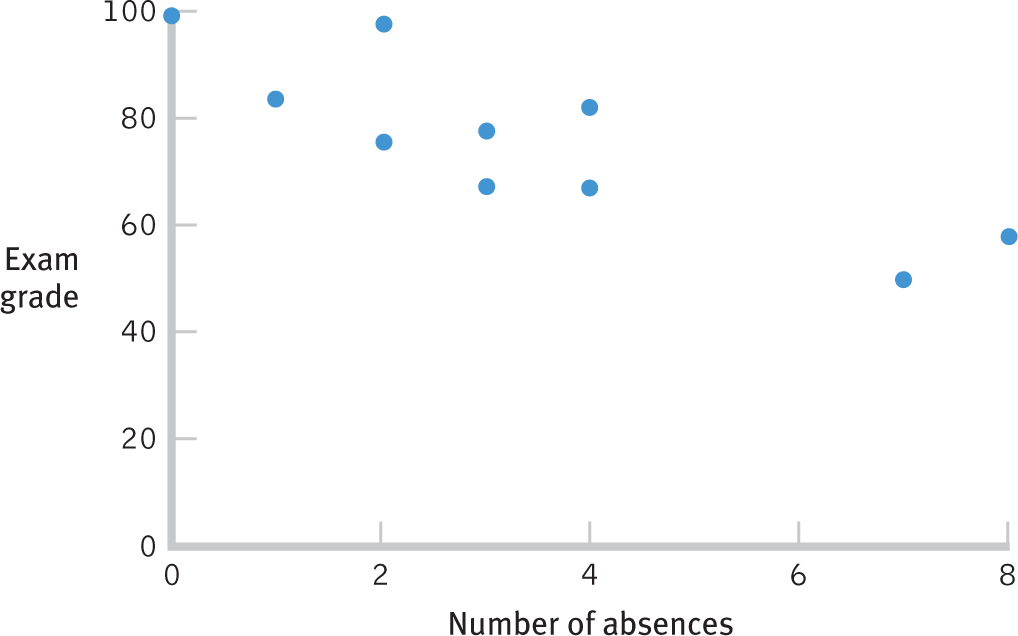
Using a Scatterplot to Examine the Assumptions We can use a scatterplot to see whether one variable varies equally at each level of the other variable. With only 10 data points, we can’t be certain. But this scatterplot suggests a variability of between 10 and 20 points on exam grade at each number of absences and a variability of between 2 and 3 absences at each exam grade.