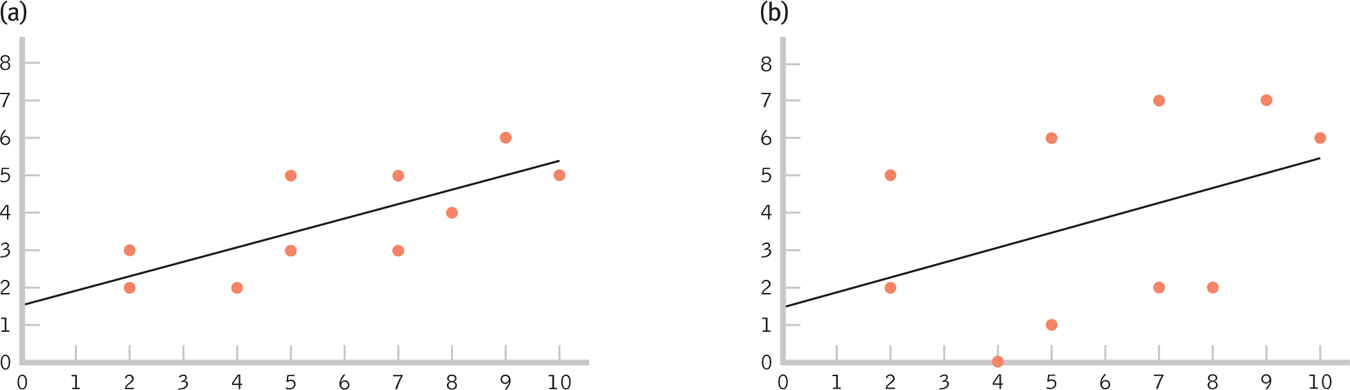
Figure 16-4
The Standard Error of the Estimate Data points clustered closely around the line of best fit, as in graph (a), are described by a small standard error of the estimate. Data points clustered far away from the line of best fit, as in graph (b), are described by a large standard error of the estimate. We have a high level of confidence in the predictive ability of the independent variable when the data points are tightly clustered around the line of best fit, as in (a). That is, there is much less error. And we have a low level of confidence in the predictive ability of the independent variable when the data points vary widely around the line of best fit, as in (b). That is, there is much more error.