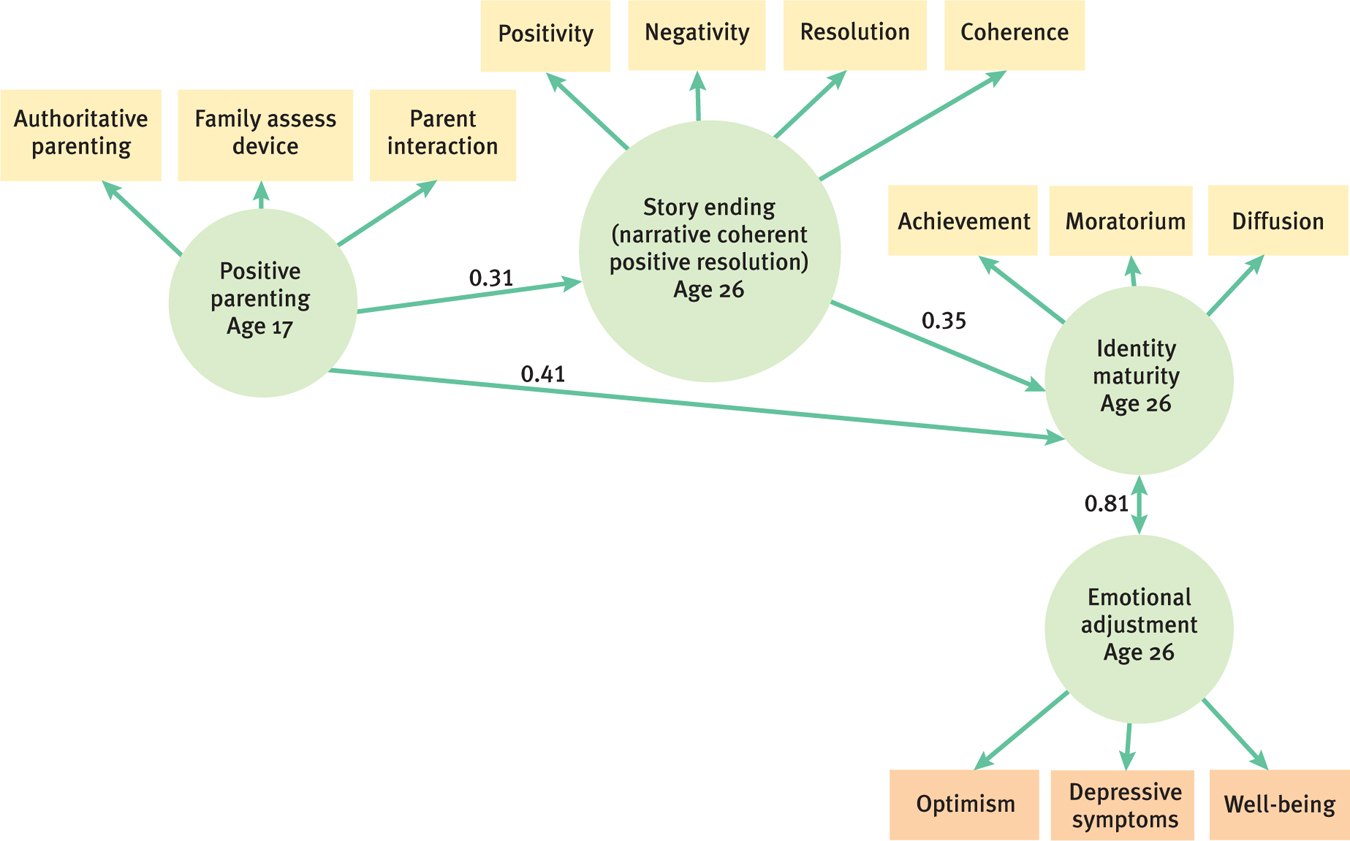
A SEM Diagram This diagram depicts a structural equation model (SEM). By “reading” the numbers connecting variables, we can begin to understand the story this graph tells. For example, the path between the left-hand circle, “Positive Parenting,” and the upper-right-hand circle, “Identity Maturity,” has a coefficient of 0.41. This indicates a strong, positive predictive relation between the type of parenting an adolescent received at age 17 and the maturity of her or his identity formation at age 26. As another example, the path between the two circles on the right, “Identity Maturity” and “Emotional Adjustment,” has a coefficient of 0.81. This indicates a very strong positive relation between the maturity of one’s identity formation and one’s emotional adjustment at age 26. The two-headed arrow indicates that these constructs are theorized to predict each other.