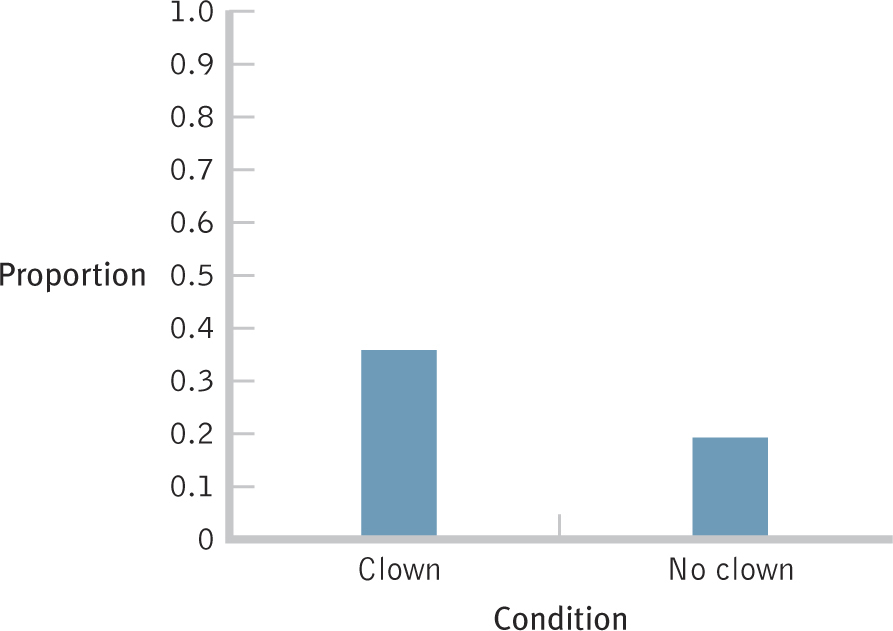
A Simpler Graph of Conditional Probabilities Because the rates at which women did not become pregnant are based on the rates at which they did become pregnant, we can simply graph one set of rates. Here we see the rates at which women became pregnant in each of the two clown conditions.