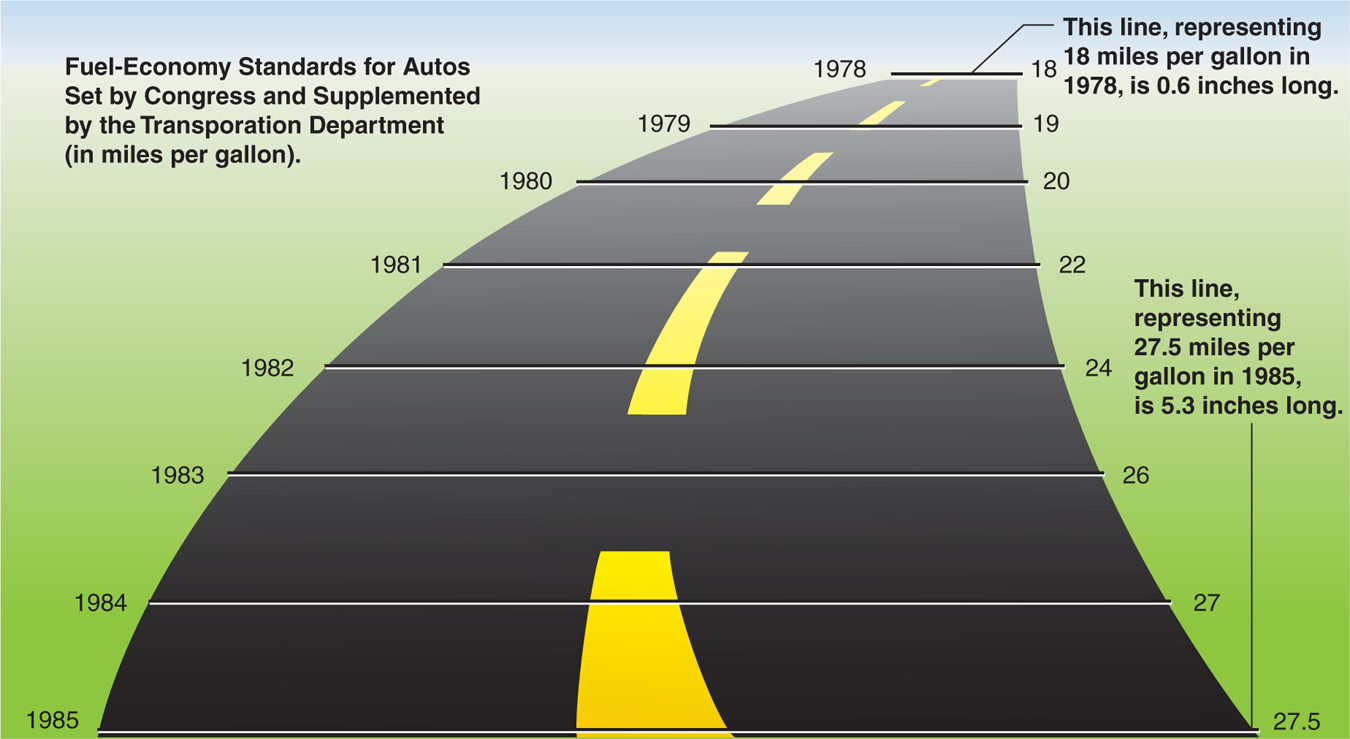
Figure 3-4
The Inaccurate Values Lie The visual lie told here is the result of a “highway” that spreads much farther apart than the data indicate. Michael Friendly (2005) says that “this graph, from the New York Times, purports to show the mandated fuel economy standards set by the US Department of Transportation. The standard required an increase in mileage from 18 to 27.5, an increase of 53%. The magnitude of increase shown in the graph is 783%, for a whopping lie factor = (783/53) = 14.8!”