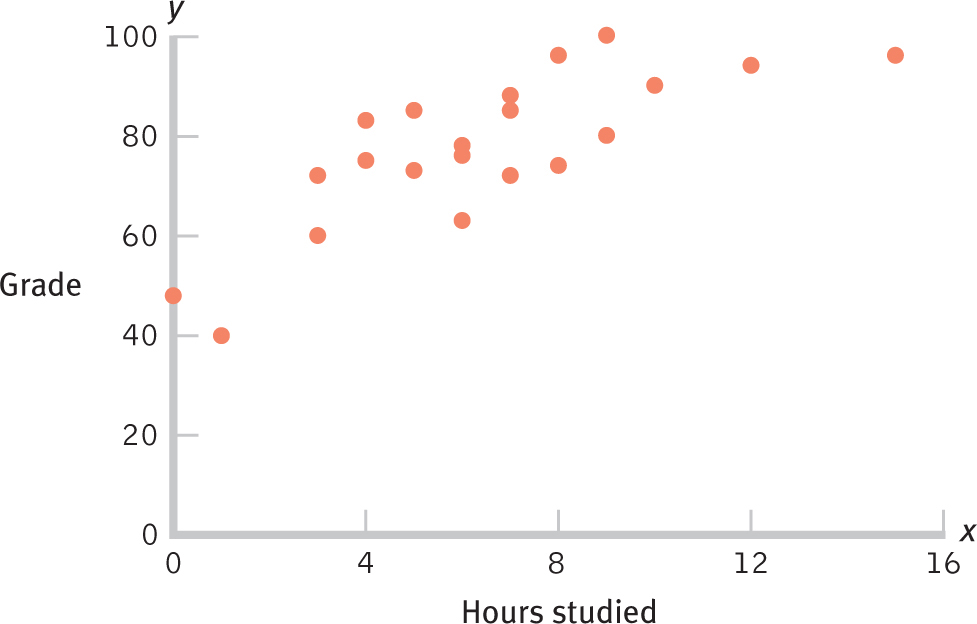
Scatterplot of Hours Spent Studying and Statistics Grades This scatterplot depicts the relation between hours spent studying and grades on a statistics exam. Each dot represents one student’s score on the independent variable along the x-axis and on the dependent variable along the y-axis.