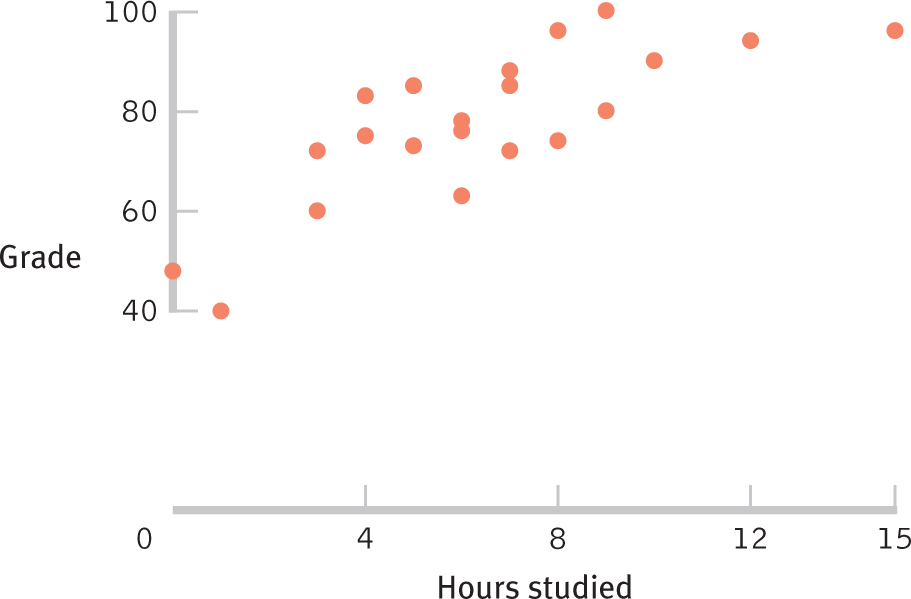
Range-Frame Improves on a Scatterplot A range-frame is a traditional scatterplot that indicates the minimum and maximum observed values on the axes by erasing all ink beyond these points. This simple alteration increases the ratio of ink dedicated to actual data to overall printed ink in this graph.