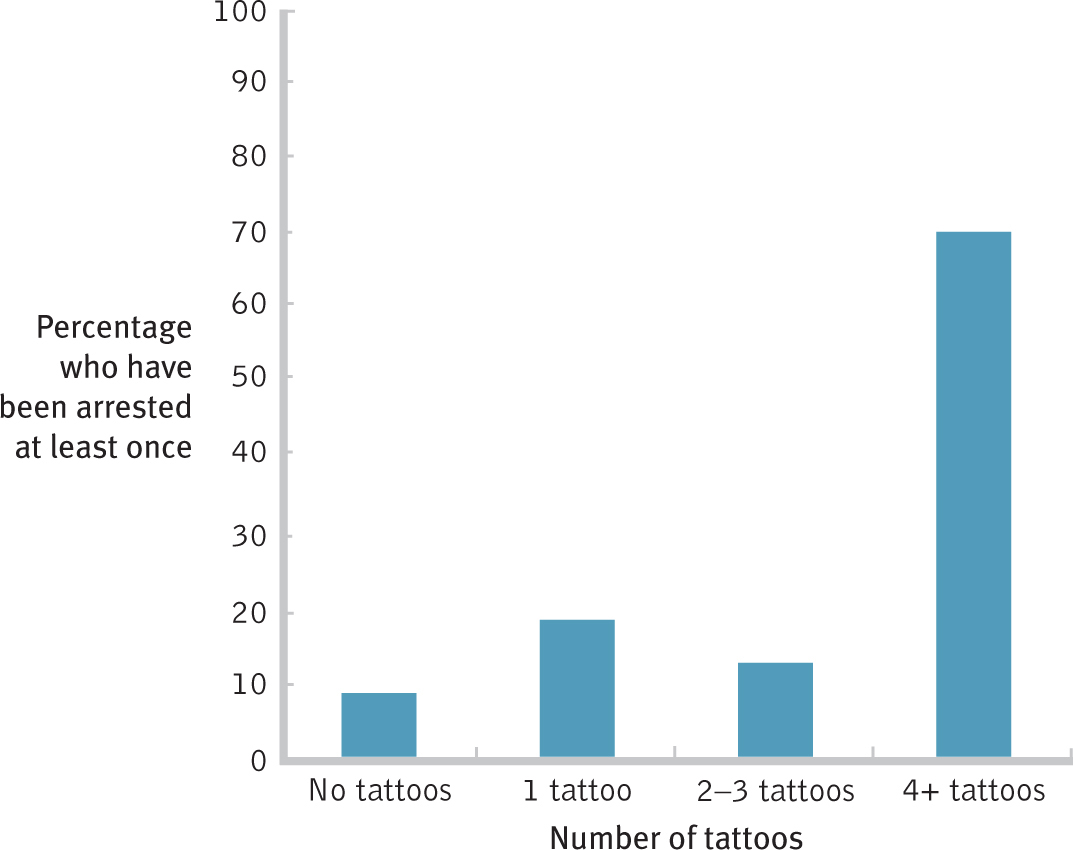
Bar Graphs Highlight Differences Between Averages or Percentages This bar graph depicts the percentages who have been arrested at least once (other than in a traffic arrest) for four groups of U.S. university students: those with no tattoos, one tattoo, two to three tattoos, or four or more tattoos. A bar graph can more vividly depict differences between percentages than just the typed numbers themselves can: 8.5, 18.7, 12.7, and 70.6.