Figure
3-
13
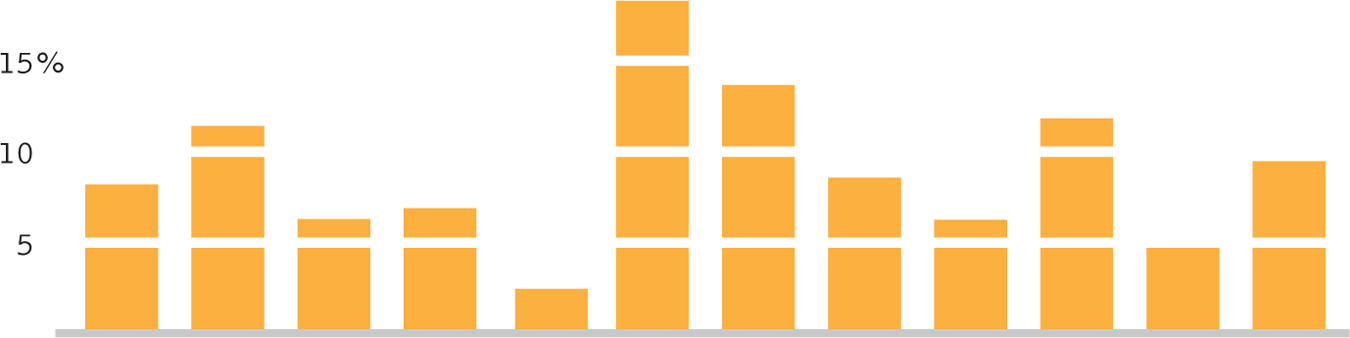
Redesigning the Bar Graph
Eliminating the frame and the
y
-axis and adding thin white lines through the bars, as suggested by Tufte (2001/2006b), makes this bar graph easier to read and increases the dat
a–
ink ratio.
Next