Figure
3-
14
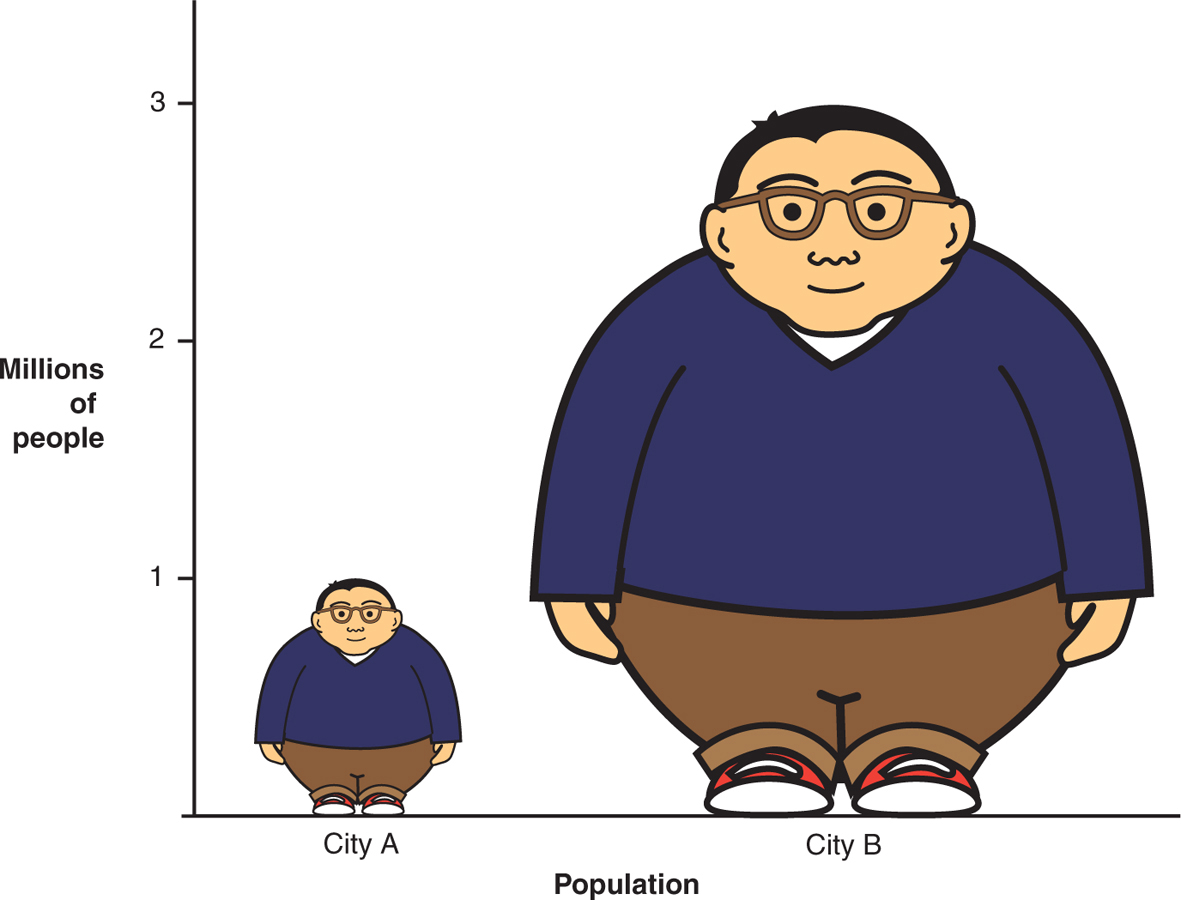
Distorting the Data with Pictures
In a pictorial graph, tripling the height of a picture is often coupled with tripling the widt
h—
which is multiplying by 2 twice. Instead of being three times as big, the picture is
nine times
as big!
Next