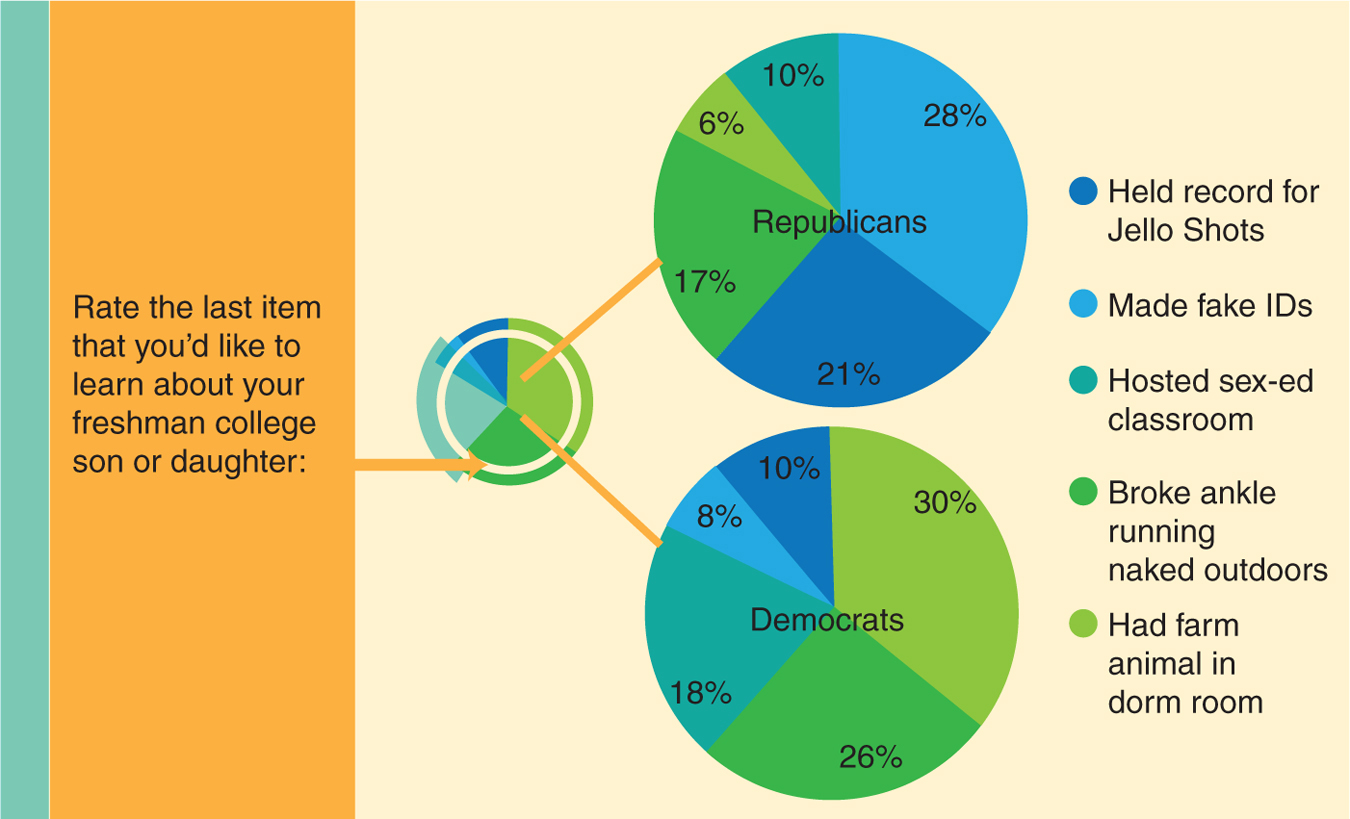
The Perils of a Pie Chart Pie charts make it difficult to make comparisons. It takes some effort to determine that 6% of Republicans and 30% of Democrats would be most upset if their children had a farm animal in their dorm rooms. It would be far easier to make this comparison from a bar graph.