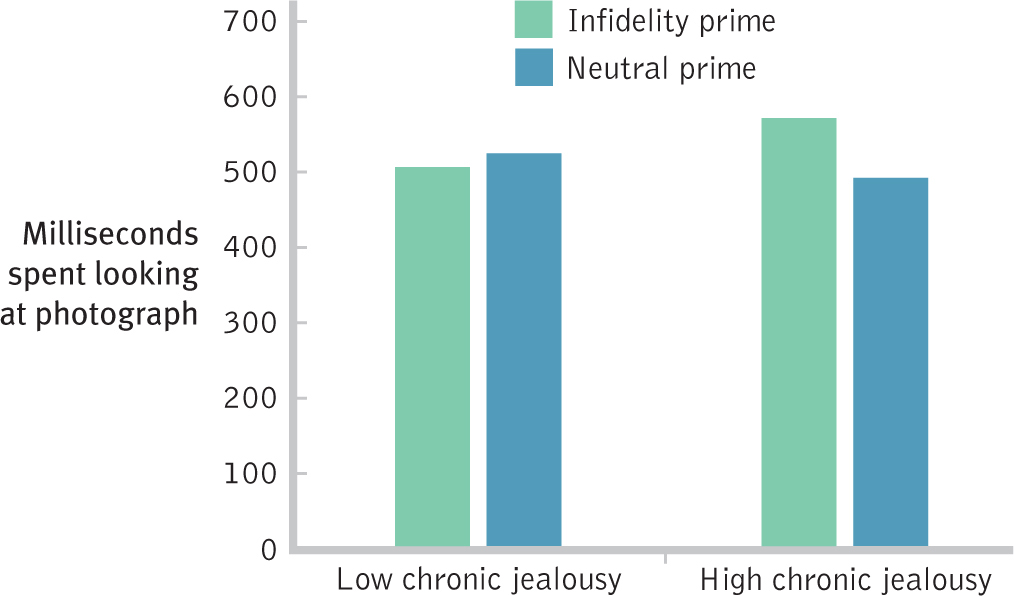
Figure 3-16
Two Independent Variables When we are graphing a data set that has two independent variables, we show one independent variable on the x-axis (in this case, chronic jealousy—low or high) and one independent variable in a color-coded key (in this case, type of prime—infidelity or neutral). This graph demonstrates that people high in chronic jealousy looked longer at an attractive person of the same sex, a potential threat, when primed by thinking about infidelity than when primed by thinking about a neutral topic. The pattern was reversed for people low in chronic jealousy.