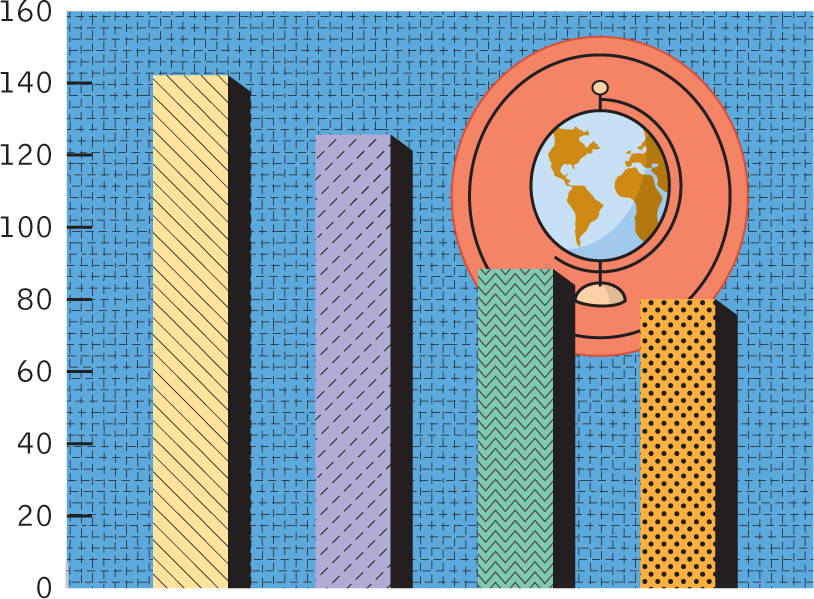
Figure 3-17
Chartjunk Run Amok Moiré vibrations, such as those seen in the patterns on these bars, might be fun to use, but they detract from the viewer’s ability to glean the story of the data. Moreover, the grid pattern behind the bars might appear scientific, but it serves only to distract. Ducks—like the 3-D shadow effect on the bars and the globe clip-art—add nothing to the data, and the colors are absurdly eye straining. Don’t laugh; we’ve had students submit carefully written research papers accompanied by graphs even more garish than this!