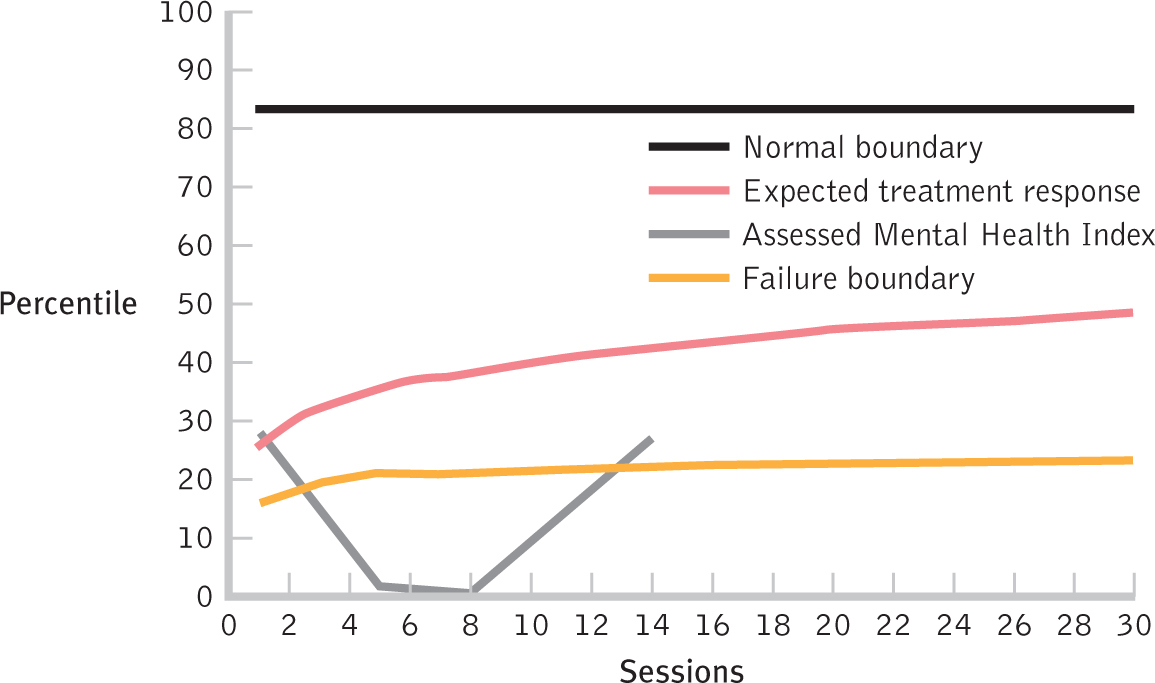
Figure 3-18
Graph as Therapy Tool Some graphs allow therapists to compare the actual rate of a client’s improvement with the expected rate given that client’s characteristics. This client (assessed Mental Health Index in gray) is doing worse than expected (expected treatment response in red) but has improved enough to be above the failure boundary (in yellow).