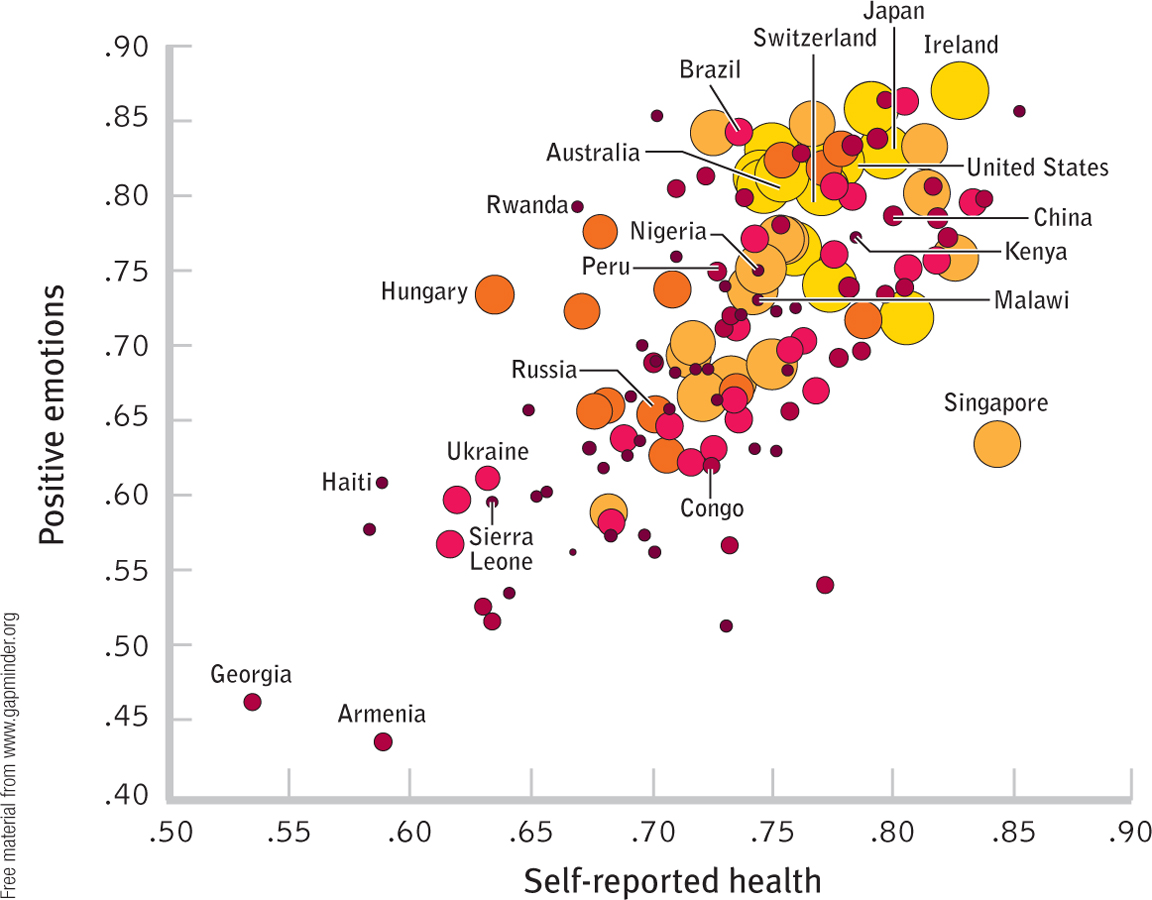
Figure 3-19
A Five-Variable Graph Increasingly sophisticated technology allows us to create increasingly sophisticated graphs. This bubble graph from a study by Sarah Pressman and her colleagues (2013) depicts four variables: country (each bubble), self-reported health (x-axis), positive emotions (y-axis), and gross domestic product (size and color of bubbles). The researchers could have had five variables if they had not used both the size and the color of the bubbles to represent GDP.Free material from www.gapminder.org

