Figure
4-
1
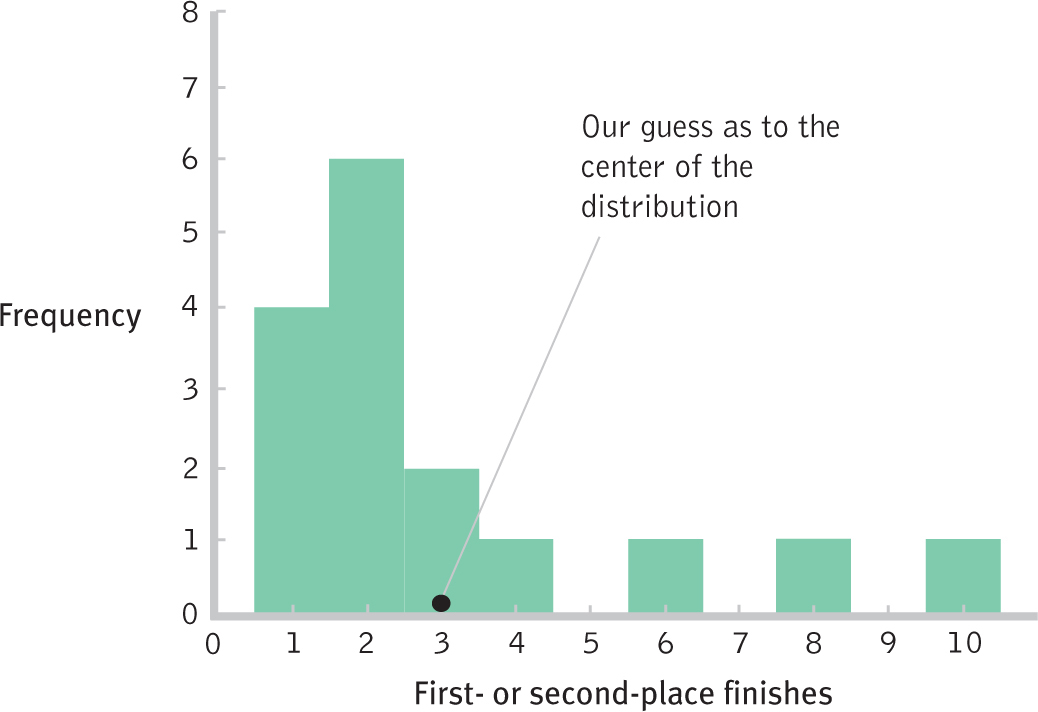
Estimating Central Tendency with Histograms
Histograms and frequency polygons allow us to see the likely center of a sample’s distribution. The arrow points to our guess as to the center of the distribution of World Cup top finishes.