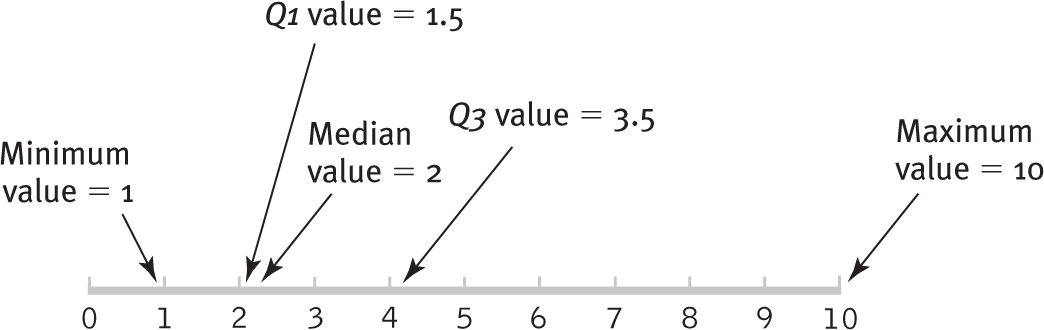
Five-Number Summary Just five numbers give a good sense of the overall distribution: 1, 1.5, 2, 3.5, and 10. These five numbers represent the scores at the 0, 25th, 50th, 75th, and 100th percentiles: the minimum, first quartile, median, third quartile, and maximum.