Figure
6-
9
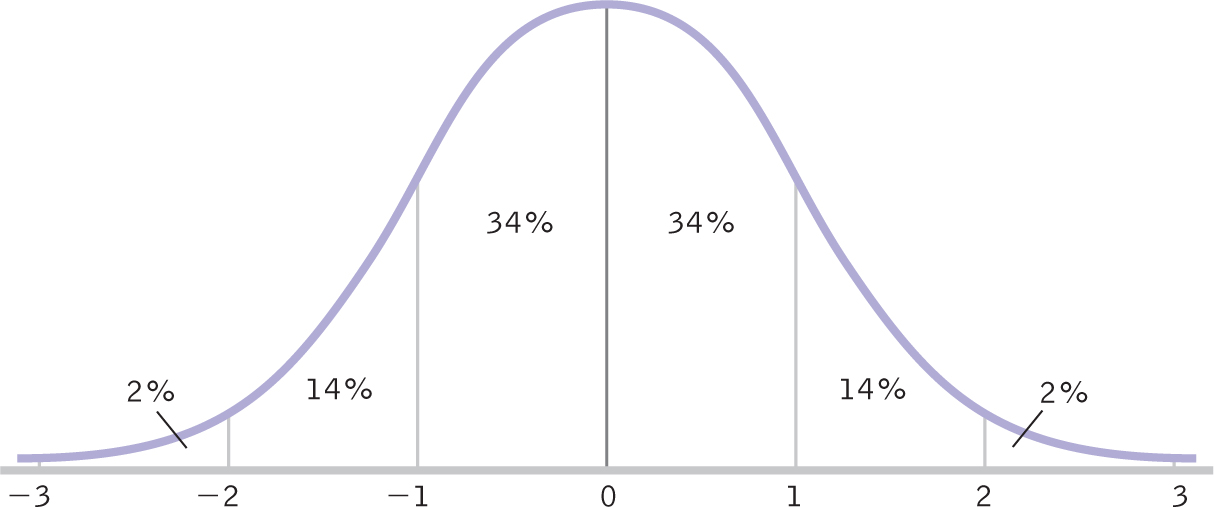
The Normal Curve and Percentages
The standard shape of the normal curve allows us to know the approximate percentages under different parts of the curve. For example, about 34% of scores fall between the mean and a
z
score of 1.0.
Next