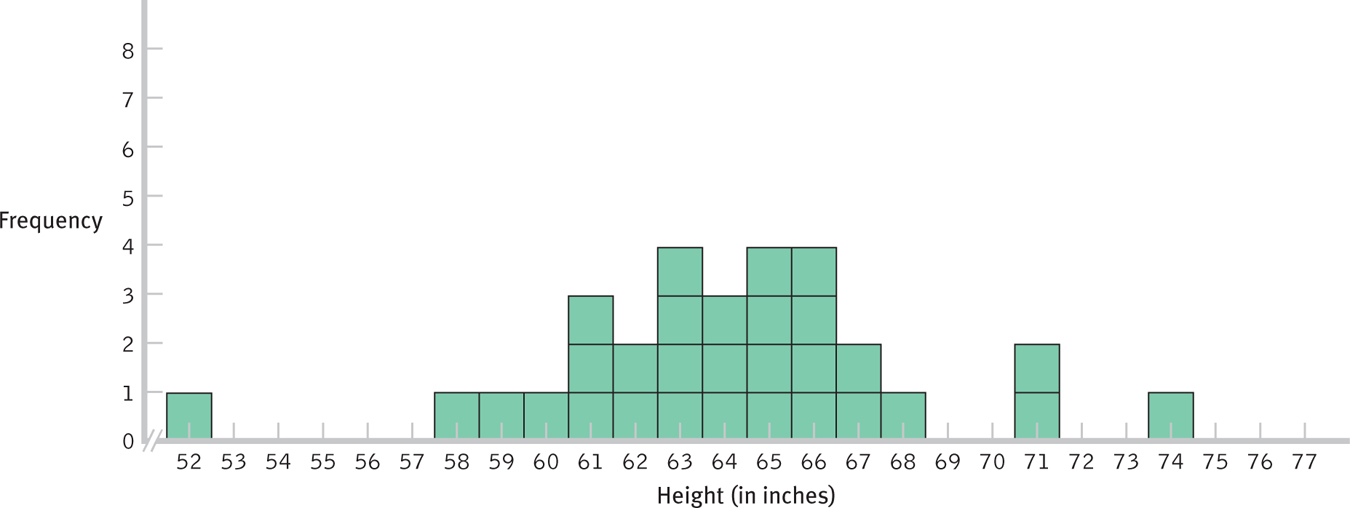
Figure 6-10
Creating a Distribution of Scores This distribution is one of many that could be created by pulling 30 numbers, one at a time, and replacing the numbers between pulls, from the population of 140 heights. If you create a distribution of scores yourself from these data, it should look roughly bell-shaped like this one—that is, unimodal and symmetric.