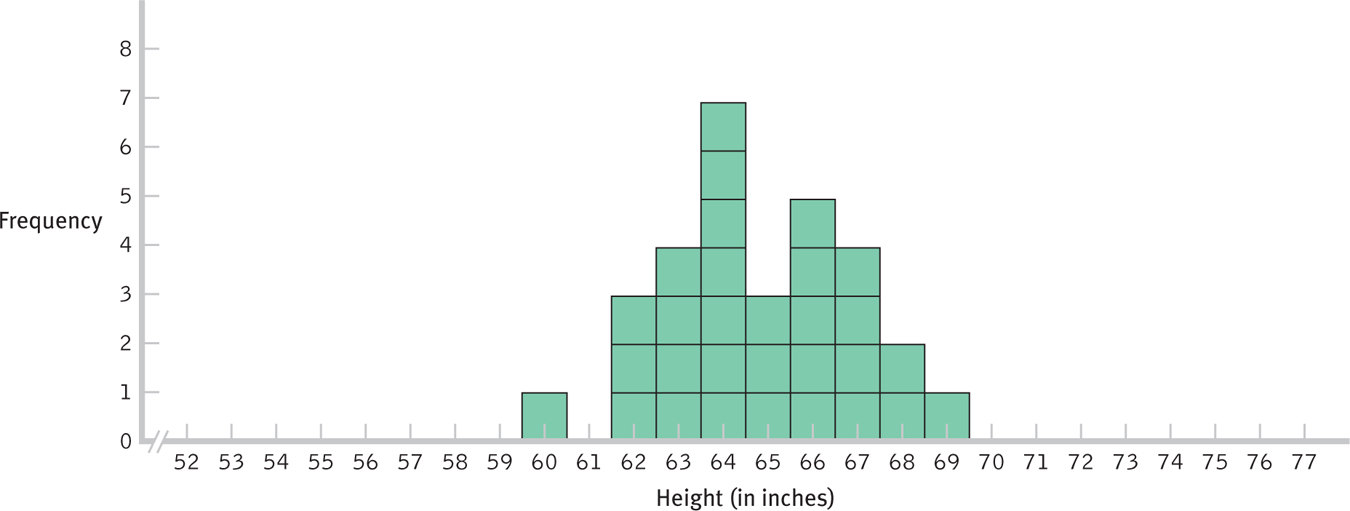
Figure 6-11
Creating a Distribution of Means This distribution is one of many that could be created by pulling 30 means (the average of three numbers at a time) from the population of 140 heights. If you created a distribution of means from these data, it should look roughly bell-shaped. Notice that it is different from the distribution of scores in Figure 6-10: Although centered around the same mean, it is narrower; the standard deviation is smaller; and the distribution of means has less spread.