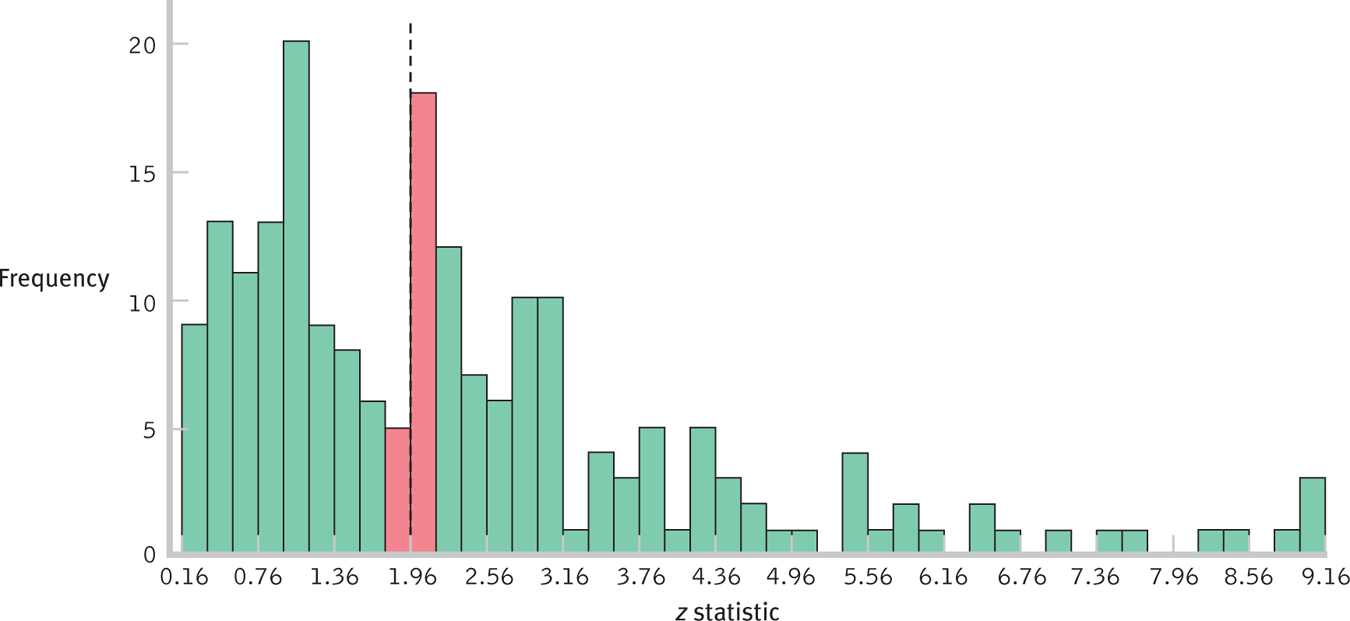
Figure 6-14
Identifying Cheaters An understanding of distributions can help us identify cheaters. This histogram of z statistics for the journals studied by Gerber and Malhotra (2006) shows an unexpectedly short bar for findings with z statistics slightly smaller than 1.96 and an unexpectedly tall bar for findings with z statistics slightly larger than 1.96. This pattern is an indication that researchers might be manipulating their analyses to push their z statistics beyond the cutoffs and into the tails so that they can reject the null hypothesis.