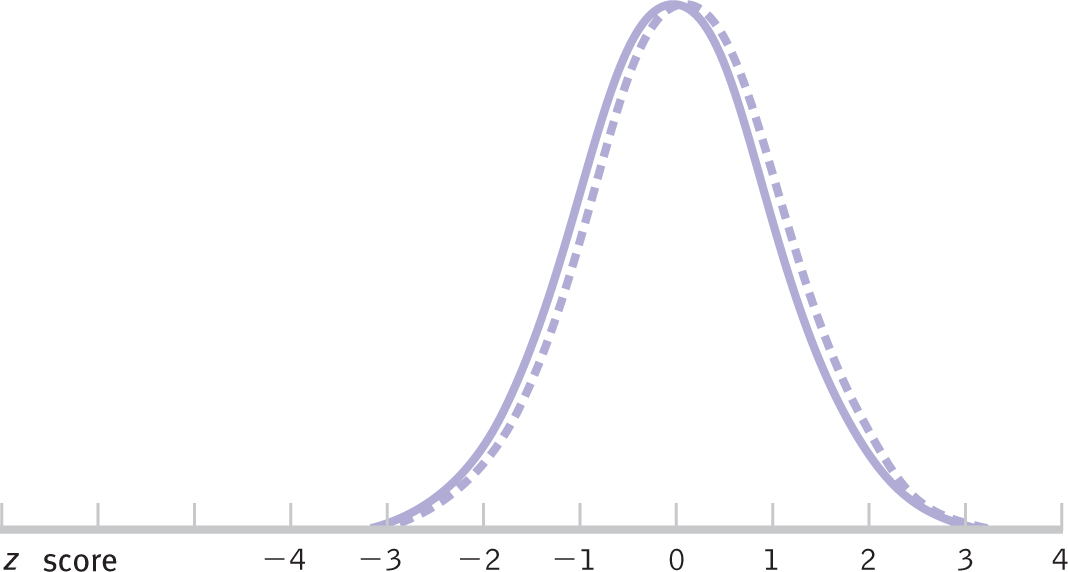
A Gender Difference in Mathematics Performance This graph represents the overlap that would be expected if distributions for males and females differed, on average, by the amount that Hyde and colleagues (1990) reported in their meta-analysis of gender differences in mathematics performance.