Figure
8-
3
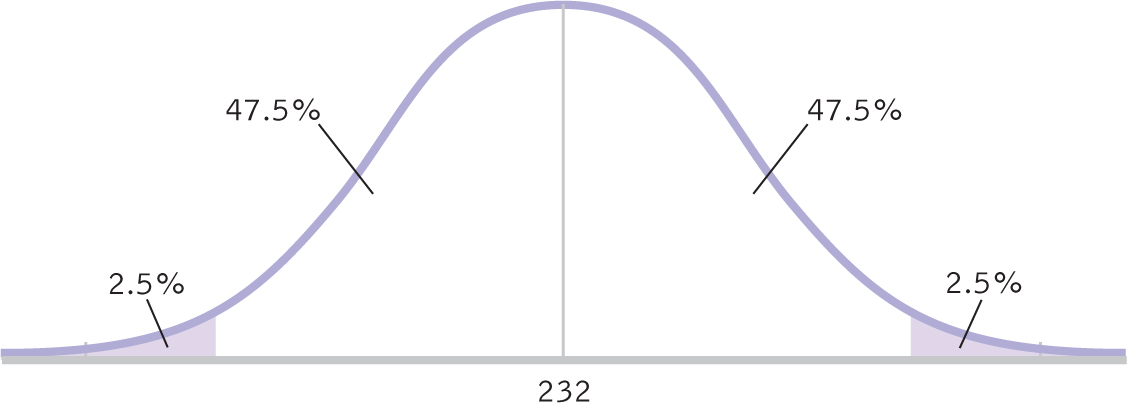
A 95% Confidence Interval, Part I
To begin calculating a confidence interval for a
z
distribution, we draw a normal curve, place the sample mean at its center, and indicate the percentages within and beyond the confidence interval.
Next