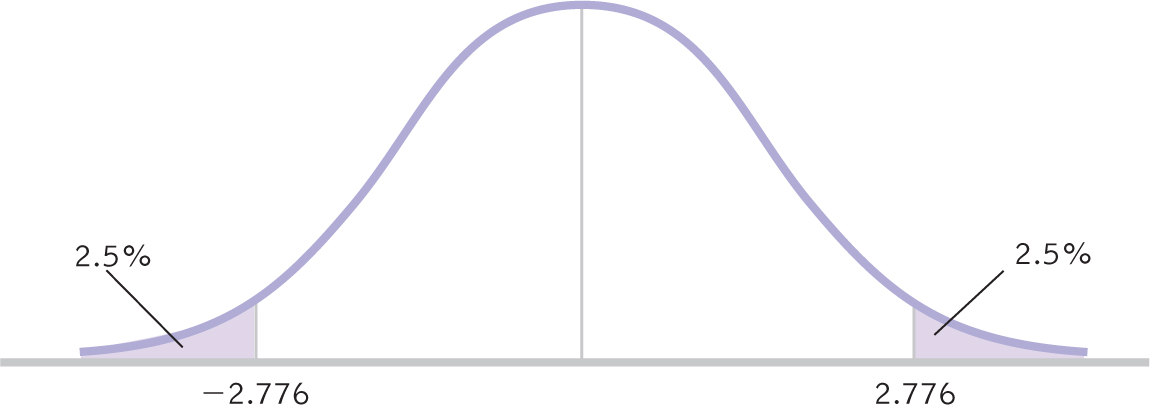
Figure 9-2
Determining Cutoffs for a t Distribution As with the z distribution, we typically determine critical values in terms of t statistics rather than means of raw scores so that we can easily determine whether the test statistic is beyond one of the cutoffs. Here, the cutoffs are −2.776 and 2.776, and they mark off the most extreme 5%, with 2.5% in each tail.