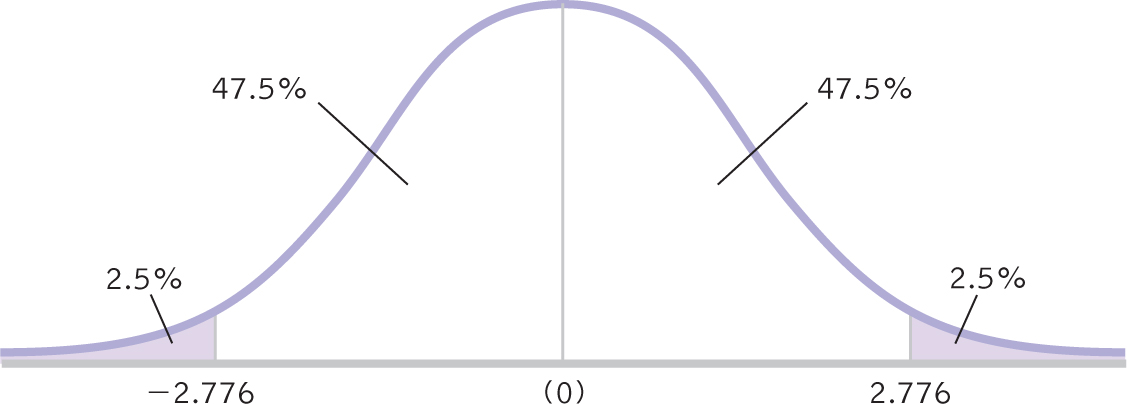
Figure 9-5
A 95% Confidence Interval for a Single-Sample t Test, Part II The next step in calculating a confidence interval for a single-sample t test is to identify the t statistics that indicate each end of the interval. Because the curve is symmetric, the t statistics have the same magnitude—one is negative, −2.776, and one is positive, 2.776.